
I think one of the more surprising areas showing strength lately is coming from the home construction names. I say surprising because a lot of data coming out around the housing market hasn’t been great to say the least. Plenty of data points suggesting more trouble to come. Easy to understand if you think of the impact higher interest rates may have on the housing market. Makes sense right? So that’s what I find interesting about these builder names. They are not doing what you would think they would be doing given the current environment and overall market for that matter. They are strong in a weak market. So that’s worth paying attention to.
I’m sure a lot of people smarter than me can attempt to explain why they are strong lately and what may change that going forward. That’s fine. For right now they are strong so for me getting wrapped up in what “might” happen is not important. The strength is there until it’s not. And right now it’s there.
Check out the relative strength the IShares U.S. Home Construction ETF (ITB) is displaying against the broader market as measured by the Vanguard Total Stock Market ETF (VTI) recently:
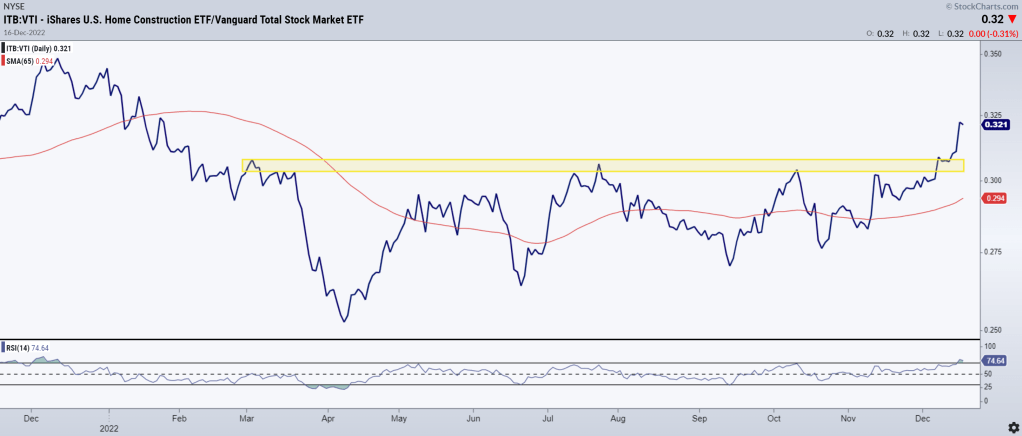
Nice breakout. So relative strength looking good here. That’s great and love to see that. However, for me, relative strength alone is not a reason to get involved. A shrinking denominator does not mean you make money. You need the numerator to go up to make you money on the long side.
So let’s take a look at the largest home construction names. All charts are on the daily timeframe.
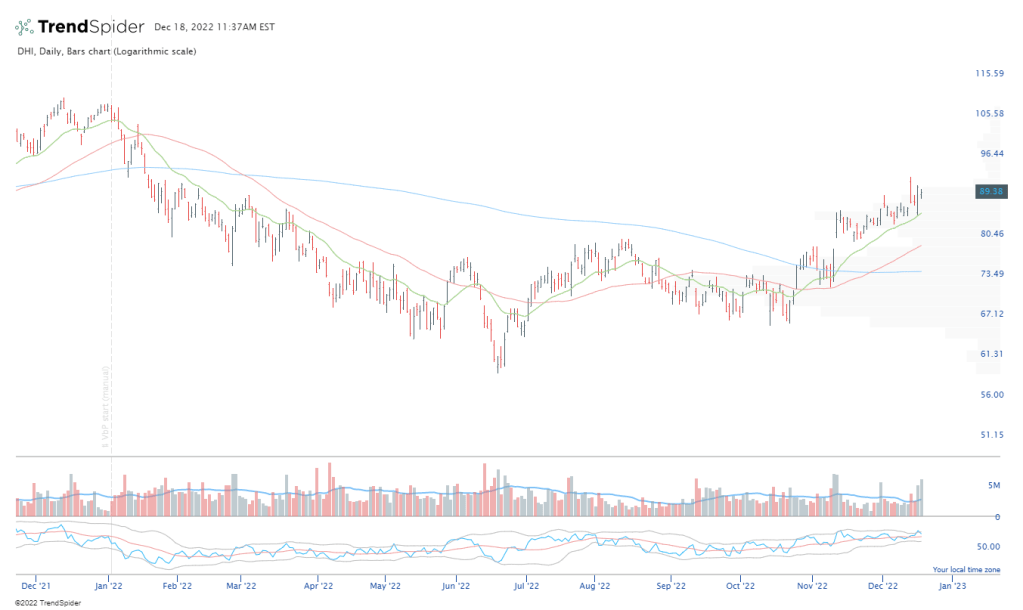
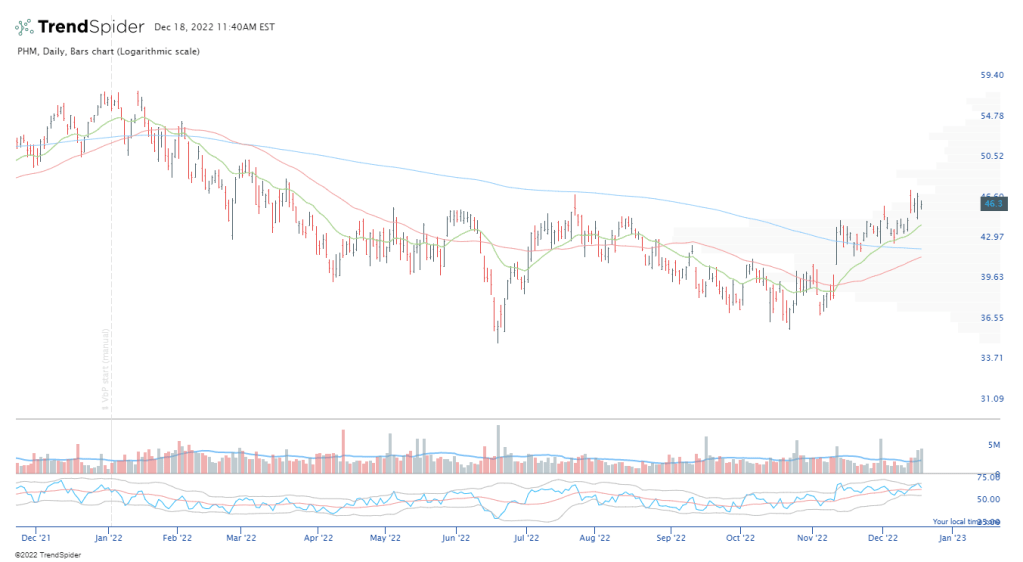
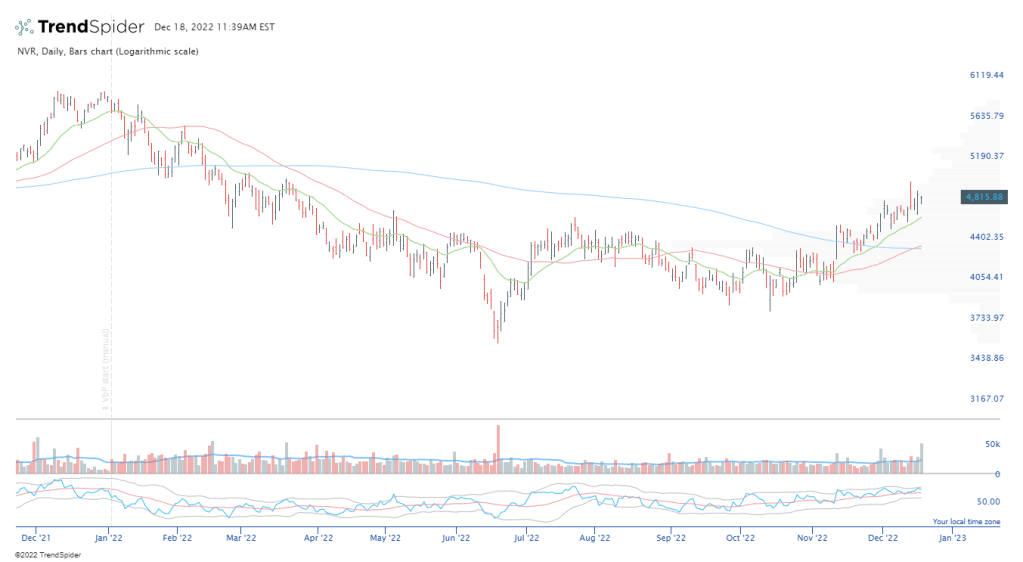
All of these look pretty similar to me. Recently over the 200 day MA (in blue) which is flattening out and should turn up soon if price maintains strength. Also, they are over both a rising 50 day (red) and 21 day (green). So the shorter term trend is strongly up in all these names and the longer term trend is also starting to turn. All of these look appealing for consideration. Of course sometimes if so many charts in a group look similar you can go with the ETF as well. Often simpler that way. I’m currently long DHI and TOL has my attention coming into this week.
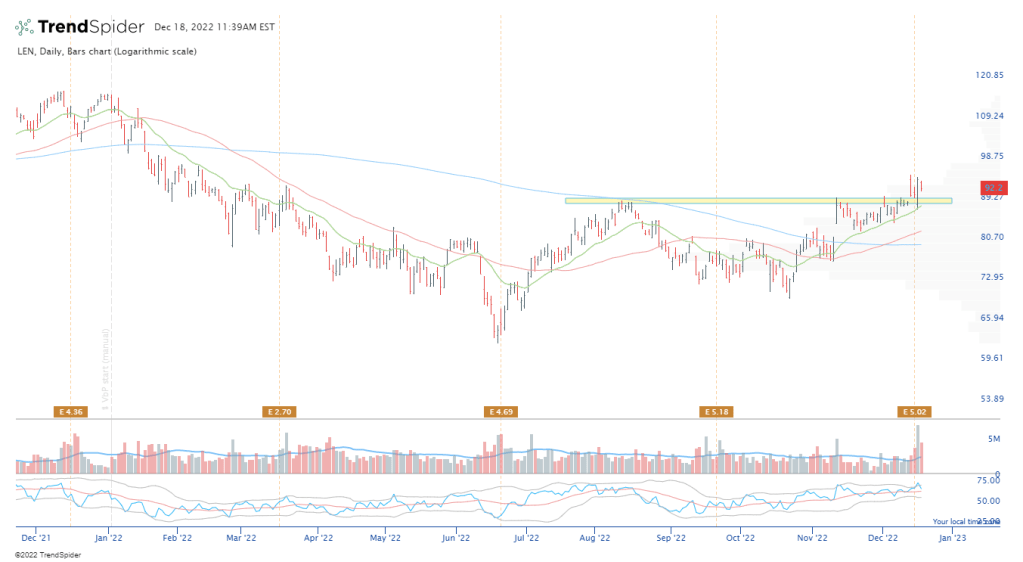
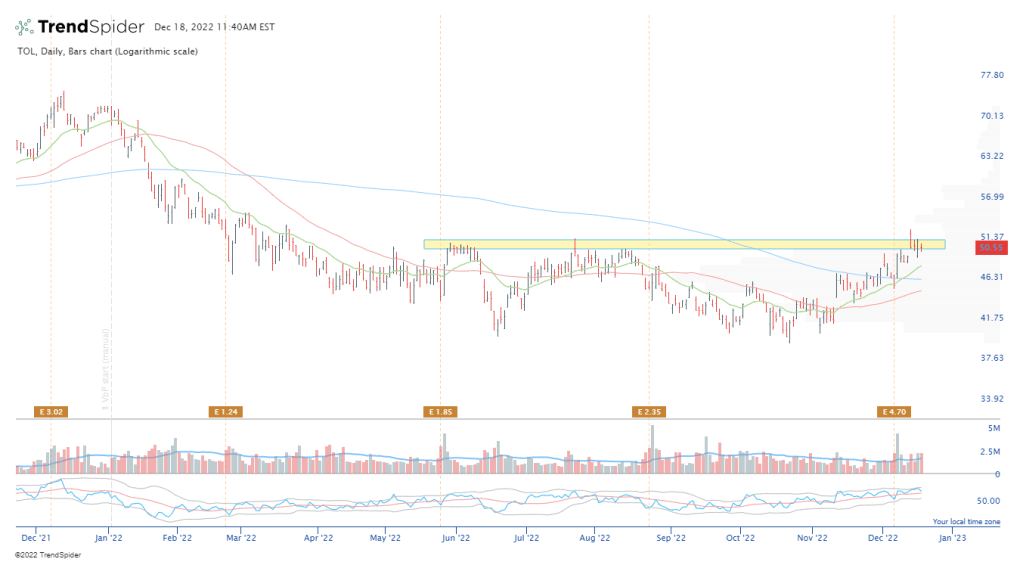
Another plus from this group is continued strong earnings and more importantly strong reaction to recent reports. Check out TOL and LEN with the recent earnings dates noted on charts. Price reacted favorably and is holding up nicely. Good to see. Oh and these are super cheap. The PE of the ITB ETF is about 6. A low PE is no reason for me to buy but I’m just pointing it out if you are interested. Perhaps all the bad scenarios are priced and earnings will continue to hold up better than expected in coming quarters? Again, not my game to make predictions like that but I’m just thinking out loud. It’s good to be open minded. It’s very possible these names come crashing down in coming months. Again, no biggie. That’s what stops and planning out the trades are for. If that happens, time to get out.
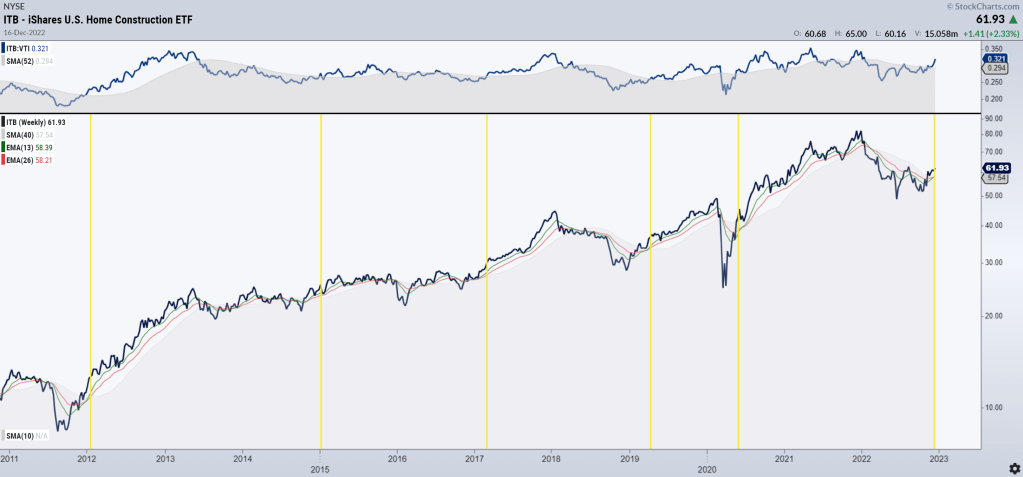
Here’s a longer term look at the ITB chart with relative strength on top. Going back on this longer term timeframe, you can see after the housing names have pulled back and started trending back up again and showing strength it’s typically been a nice group to be involved in.
We’ll see what happens to these names but I think there is something interesting going on here worth paying attention to. Thanks for reading!
