
Although I post charts from time to time on Twitter and Stocktwits it’s been well over a year since I posted on here so hopefully this works! Usually my thoughts are around shorter term setups in individual names but I just had some thoughts that came to mind thinking longer / bigger picture here I wanted to share.
When I first created this site a number of years ago, I posted that despite having a buy and hold mentality more or less driven into investor’s heads from early on, I don’t think this has to be the only answer. In fact, depending on the circumstances of different investors, this can be a bad and potentially dangerous approach. Also, I’d argue lazy. Here’s that post – https://gktrading.net/2017/11/02/the-case-for-active/.
I thought this post was timely given the general market performance this year and will use the SPY (S&P 500 ETF) as my proxy for the “market” for the remaining write-up. I know SPY isn’t the “market” due to it’s composition and having such a small weighting (less than 6%) in the Energy sector which has been a huge outperformer. Obviously if you own SPY you aren’t feeling that but that’s not the point of this post. I’d bet for most passive investors with stock exposure, that exposure tracks pretty close to SPY so I’ll assume SPY is the “market”.
Markets often trend. Usually up but when they are going down it can be nasty and take a long time for your portfolio to get back to it’s previous highs. As mentioned in the 2017 post linked above, it took 13 years to recover from the losses after the top in 2000. 13 years! That’s a long time. This isn’t some new phenomenon either. Similar situations have occurred throughout the past and will absolutely occur in the future. This is a main argument to defend just buying and holding / hoping. The market always recovers. It may take time, but it will get there. While this has proven to be true historically it’s also true that not everyone has the luxury or the desire to wait a decade or more to recover their losses.
So what to do? What you don’t want to do is get out because you think stocks are done and never get back in. In a bear market it might be a good short term decision and provide individuals with piece of mind. However, the market is an incredible wealth building tool so longer term, the decision to abandon the market will likely be a costly one. The buy and hold approach has this right. But what if you can have the best of both worlds and limit those scary drawdowns but still capture the overall market upside? Well I think you can. You can pick your spots and participate when it’s worth participating and sit out (or find alternative investments) when the market is going down. Sounds easy but how can you tell which is which? Below I show the results of two very simple strategies for a longer term time frame. These strategies give very infrequent signals (average about 1 for every two years) but are good examples of ways to help determine if we should be participating or sitting on the sidelines.
Keep in mind, these are just examples using historical data. There’s no magic to the input selections or methodology and there is no guarantee they will work over the next 30 years. I just chose these to illustrate the importance of longer term trends and most importantly how beneficial it can be to avoid participating in downtrends as long as you participation is resumed when the wind is at your back.
Here’s the first based on the slope of the 13 month EMA. The idea is to be long when this is moving up and exit when the slope turns down. Simple. Here’s a visual of the chart (from TrendSpider) with entries and exits:
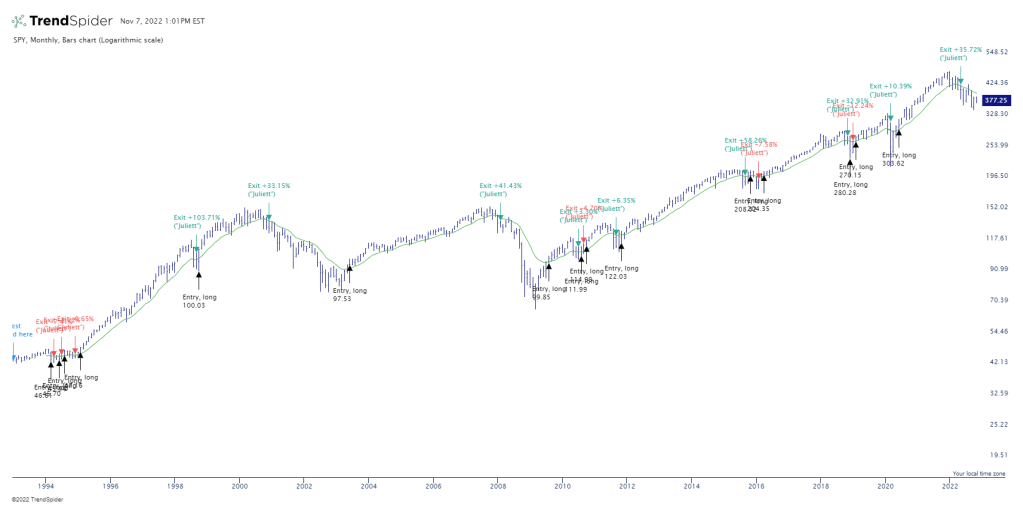
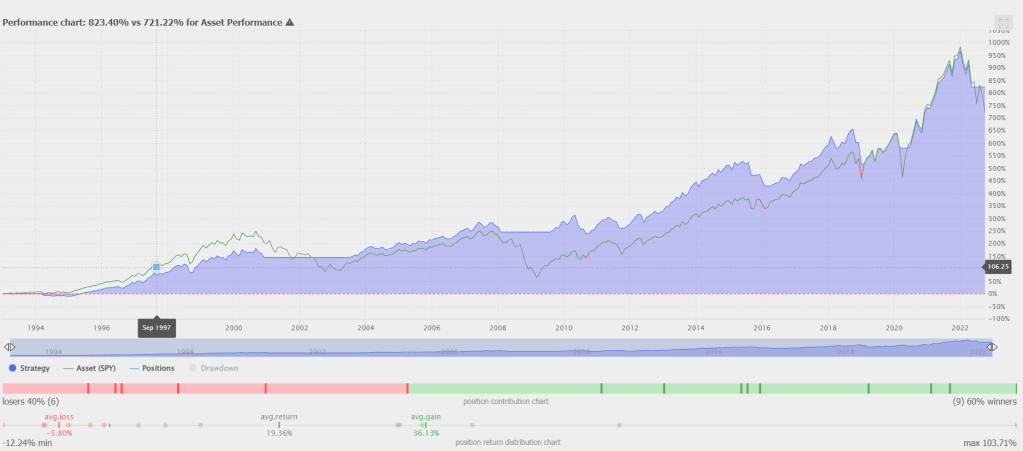
Looks to do a pretty good job capturing the chunks of positive returns and avoiding big losses. I will point out, that these types of strategies often have some chop periods where signals are generated but there’s really no trend continuation (see 1994 for example). There are ways to potentially mitigate this but there’s no magic and I wanted to keep it simple. So the chart looks good now let’s look at the numbers from TrendSpider (great strategy tester from them by the way) to see some performance stats:

OK. I like what I see. Overall performance much better than SPY. Only 15 positions taken in the 30 years. As mentioned, this example is to stay with the longer term trend so is not very active. The win loss ratio is impacted by some of the chop mentioned above. What I really like is the 36% average win compared to -6% average loss and -18% max drawdown. So here we have an example of a way to beat the market and still be able to hang on to your hard earned money if things aren’t going well and wait till that changes. The equity curve chart below really highlights the power here. Look how it stays nice and flat during those nasty market drawdowns:
Here’s one more for fun. This is long SPY when the 13 week EMA (one quarter) is above the 26 week EMA (half year). I also added a 10% max stop loss on new positions. Here’s a look at recent signals on the chart (the actual test goes back 30 years like the above):

So similar to the first test although the time frames and methodology are different. Now let’s see how the results line up:

Interesting that there’s actually less signals here at 13. Overall, pretty comparable and impressive results. Last, let’s look at the equity curve which will look familiar:

Looks great. Staying out of the longer term bear markets and staying flat during those tough periods, makes it that much easier to reach highs if you can get back in. You just have to be comfortable knowing you are not going to buy the bottom or sell the top using a strategy like this. That’s OK.
Like I mentioned, nothing is perfect (along with these tests going back 30 years) but I think the point is critical. If you are not a very active investor, I think it’s well worth it to employ some type of longer term market timing strategy to keep you out of the bears and participating in the bulls and help you rest more easily. If you are more active, these are just another example of how important it is to stay on the right side of the trend for your timeframe.
