
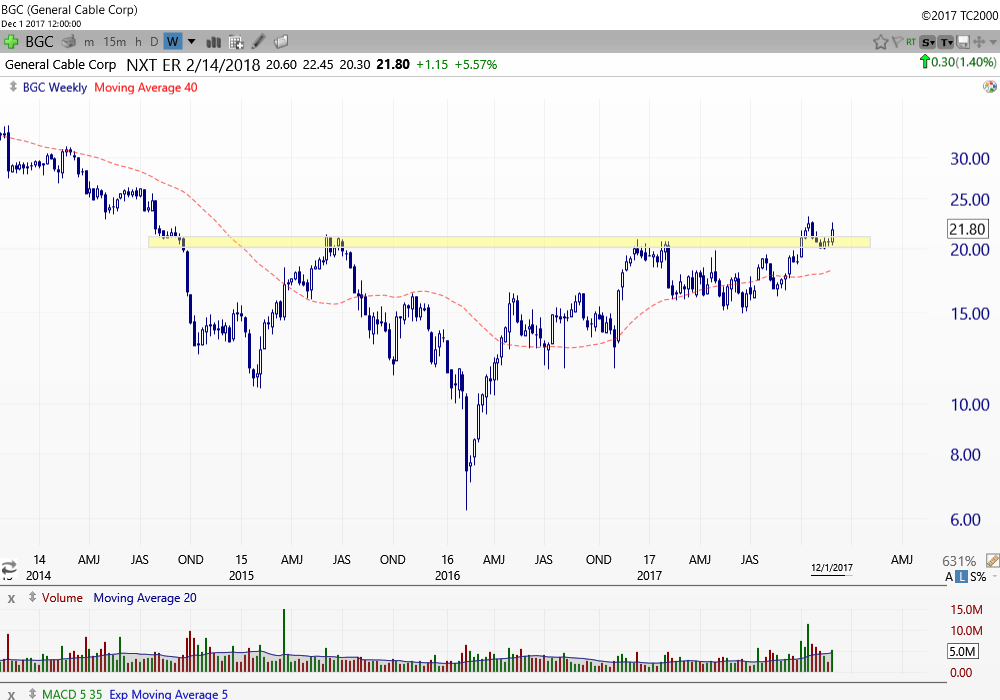
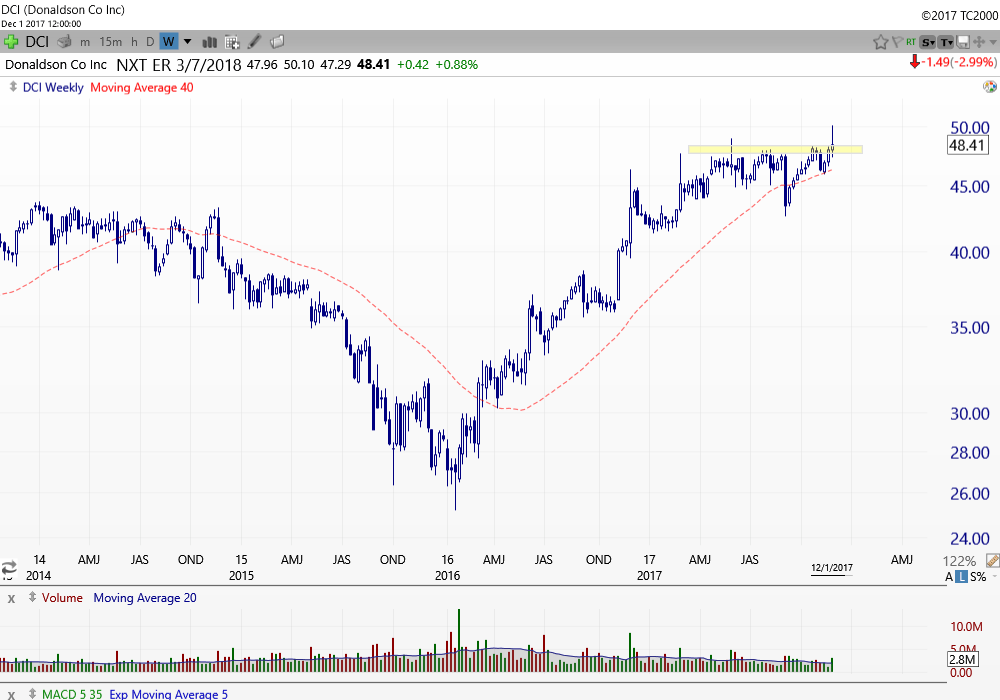
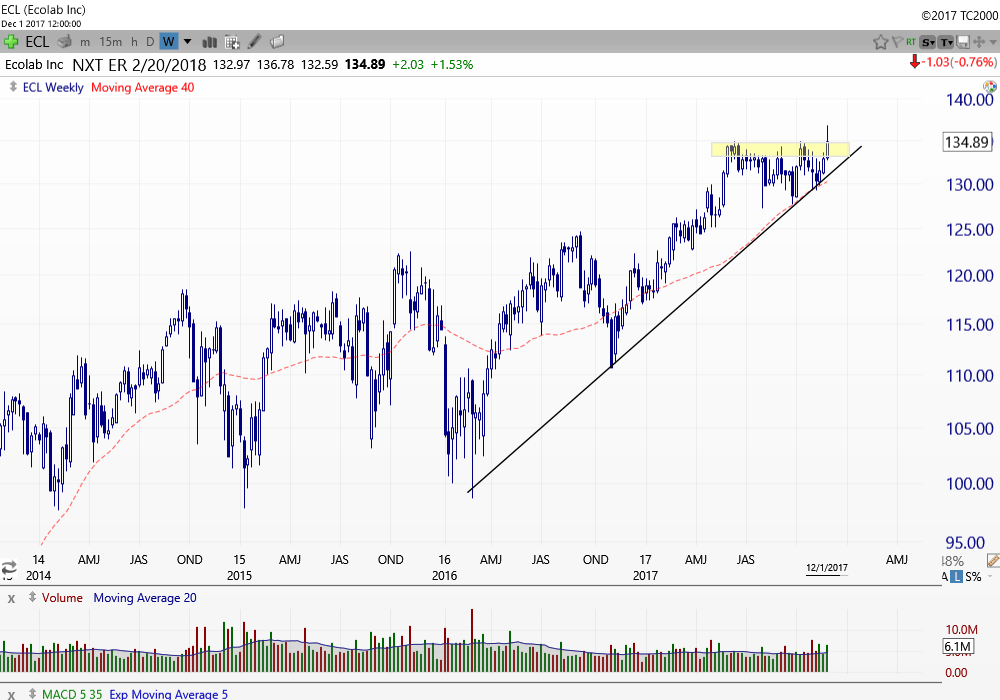
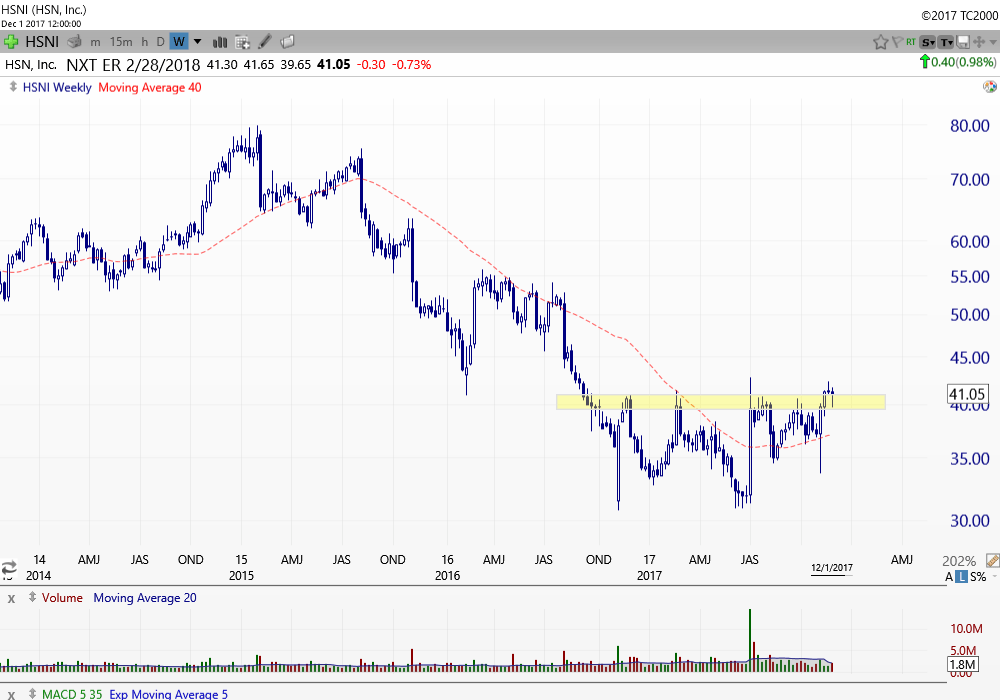
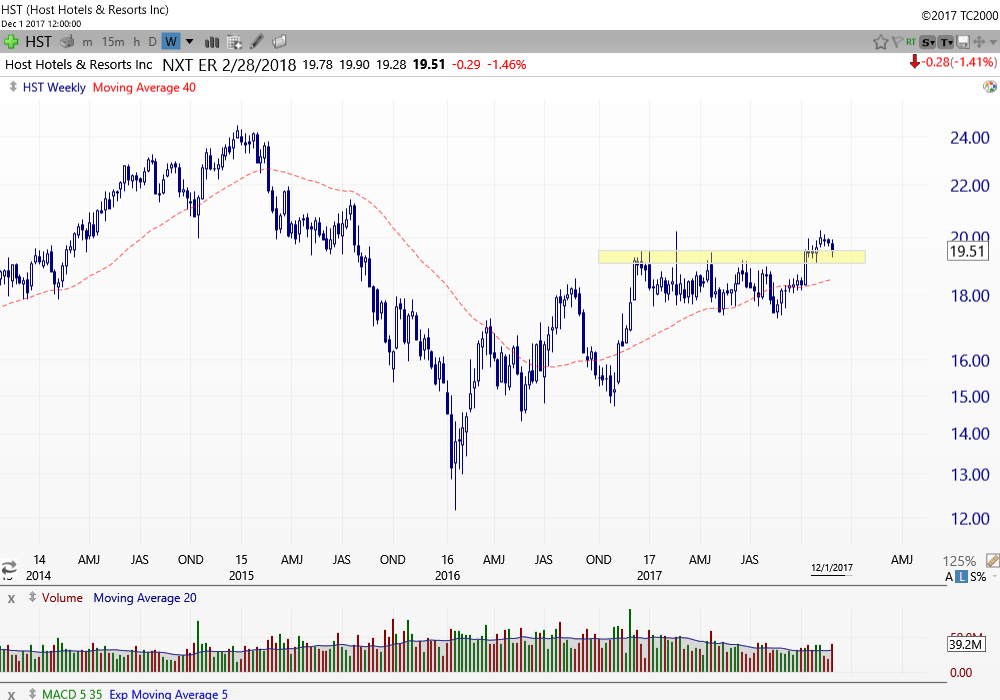
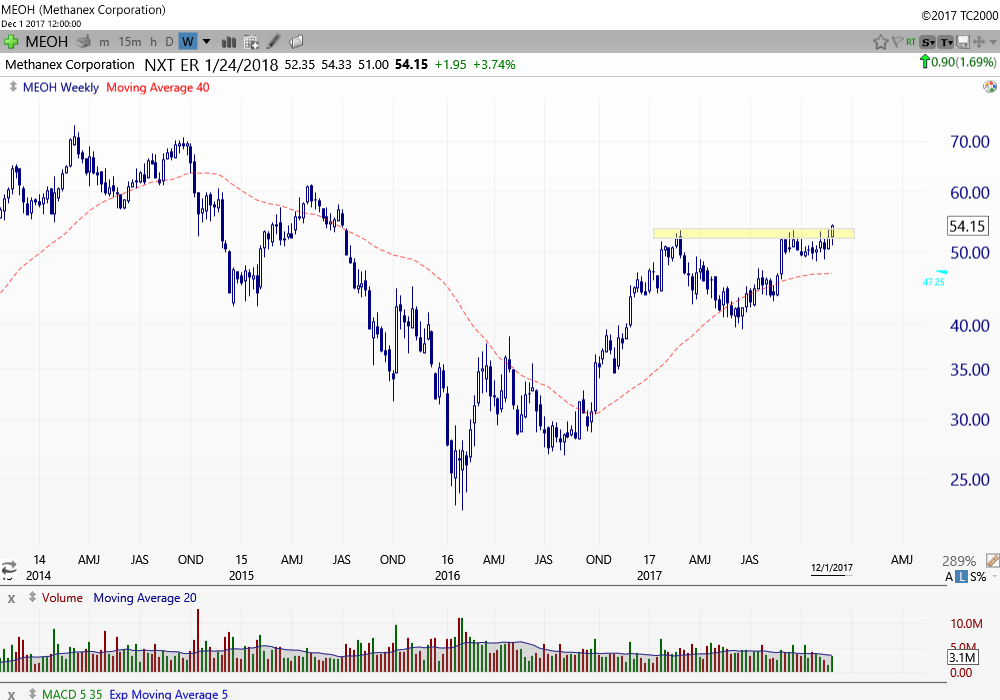
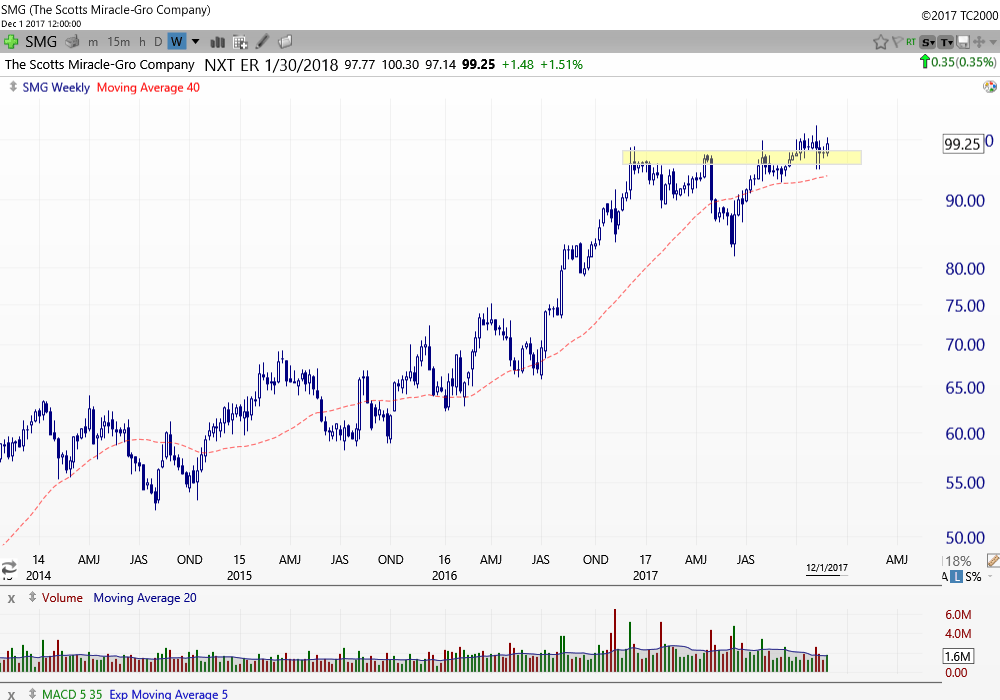
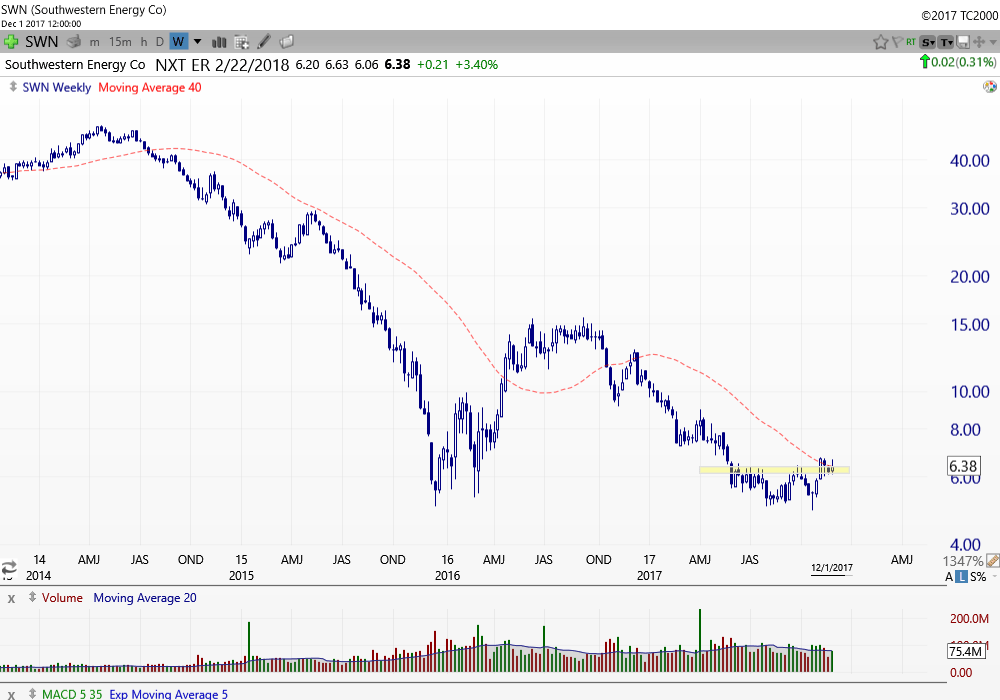
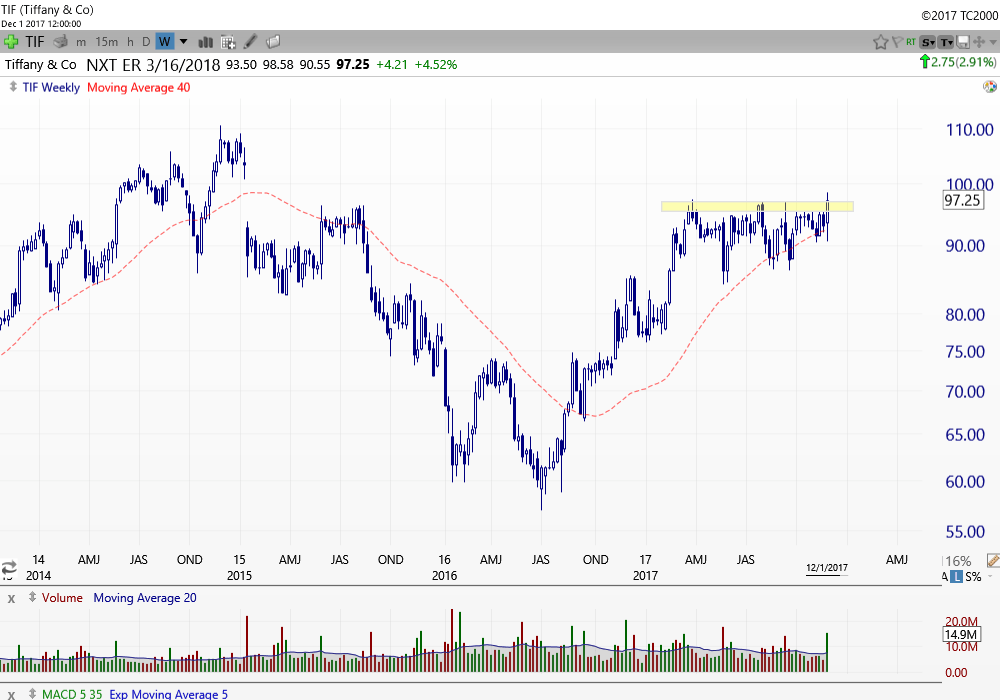
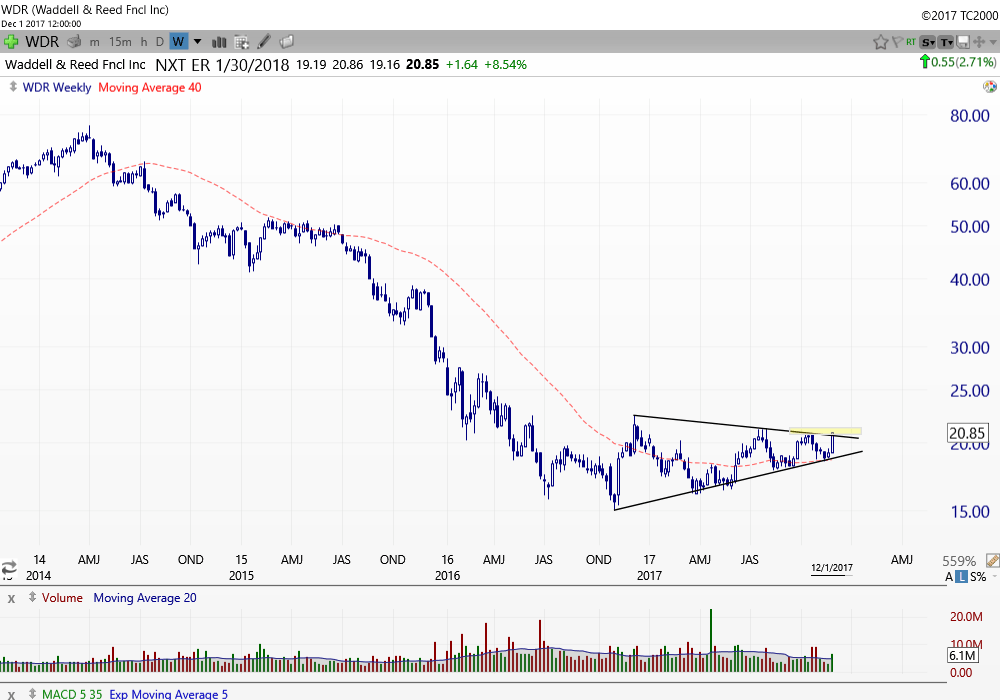
You probably know by now that weekly charts are my default view when analyzing any stock. I use shorter time frames to determine my trade entries and exits but weekly charts going back a few years are what I primarily base my trade decisions on and how I build my watchlists to plan for the upcoming week. This weekly view allows me to quickly identify the long term trend and can see if there may be any potential overhead resistance areas that might be missed when only looking at shorter time frames. It also helps in identifying key the key support and resistance levels that I base all my trading decisions on.
I’ll get to it. Here some weekly charts that have my attention going into next week. As usual I’ve highlighted key areas. For long ideas, I’m only interested in these above these areas.
These are a few I’m keeping an eye on. I’ll be posting my full list on TTP Trading (https://ttptrading.com/). If interested, please check it out while our early bird pricing still applies.
I hope you all have a great weekend!
