
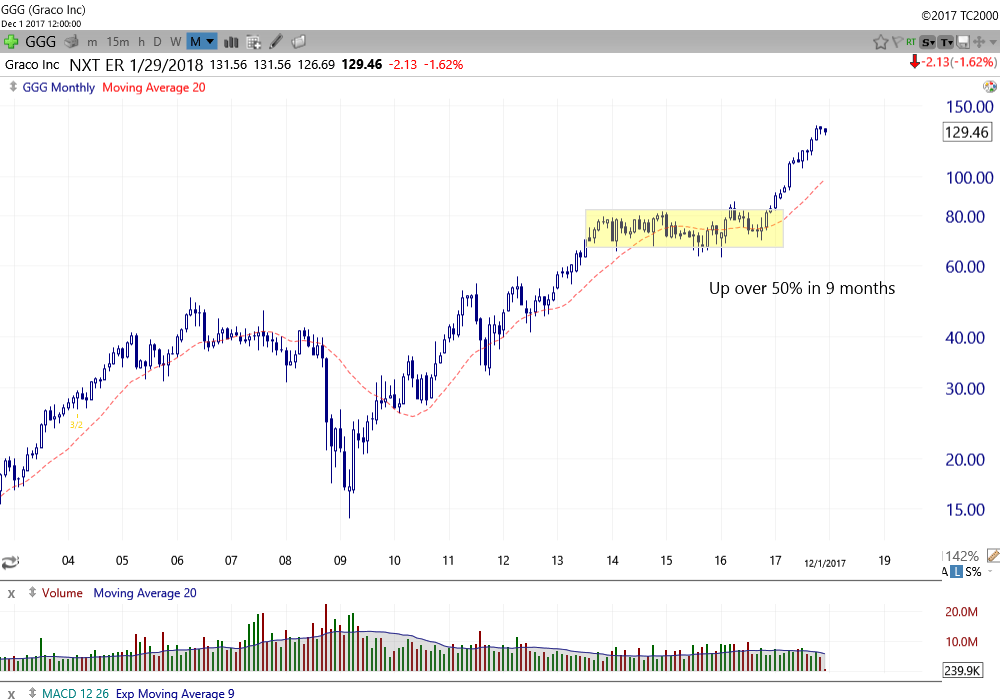
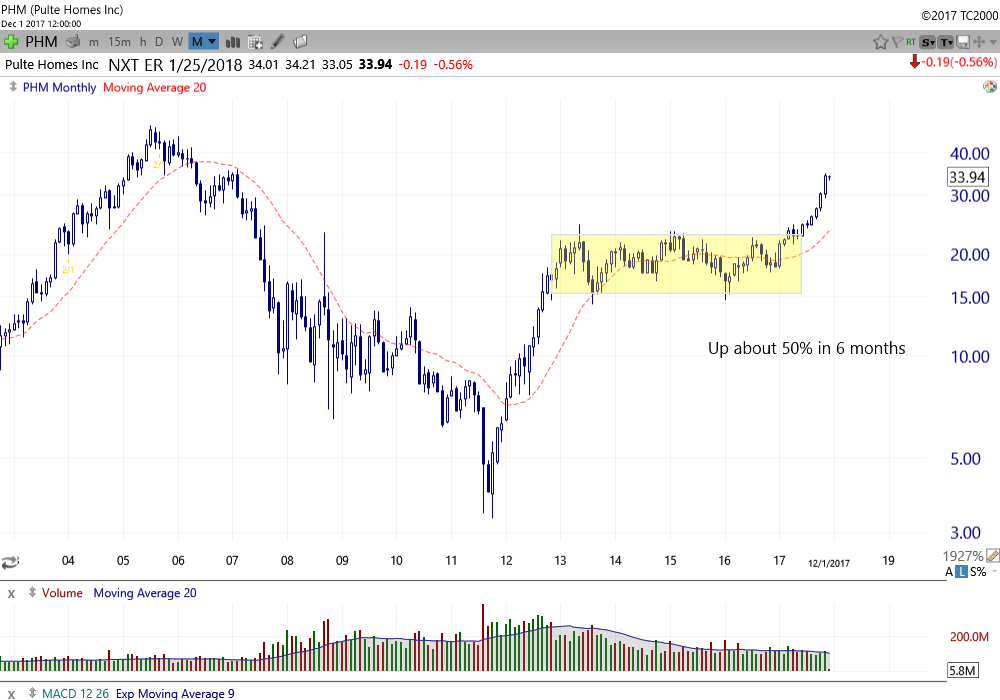
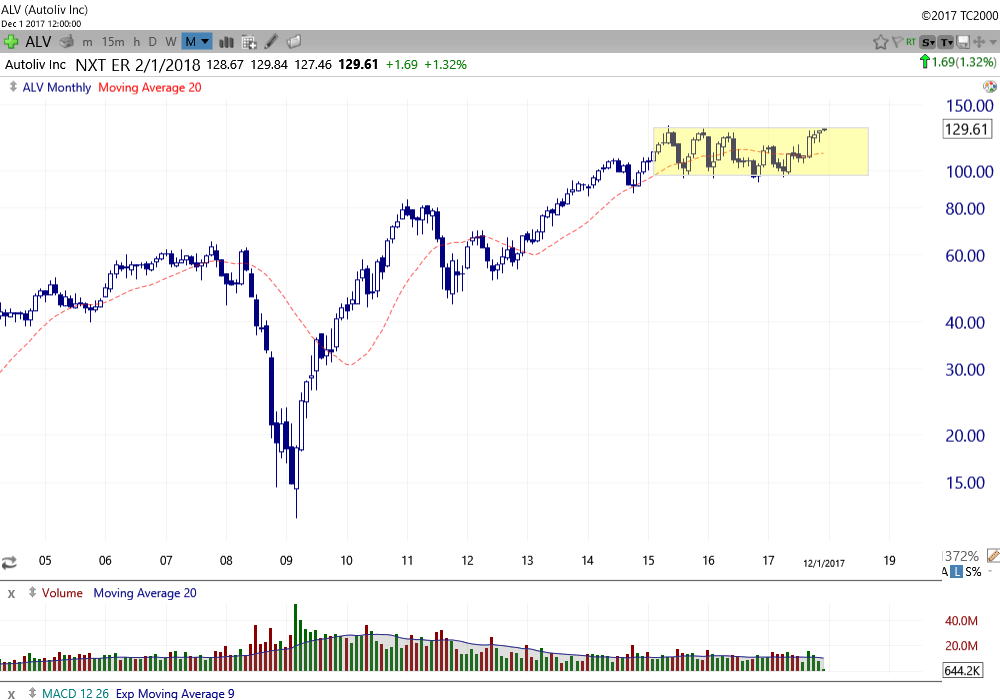
I typically don’t post a lot of monthly charts but they are definitely something I use in my process. They really help you step back and see the big picture. I’ve noticed a number of powerful moves occur after multi-year consolidation breaks. A stock can break out of a consolidation like this for many reasons but I’m not too concerned about the reasons. What is important is that, for whatever reason, the stock is now seeing buying pressure after being range bound for a long time. Let’s let the charts do the talking. Here’s a couple examples of what I’m talking about:

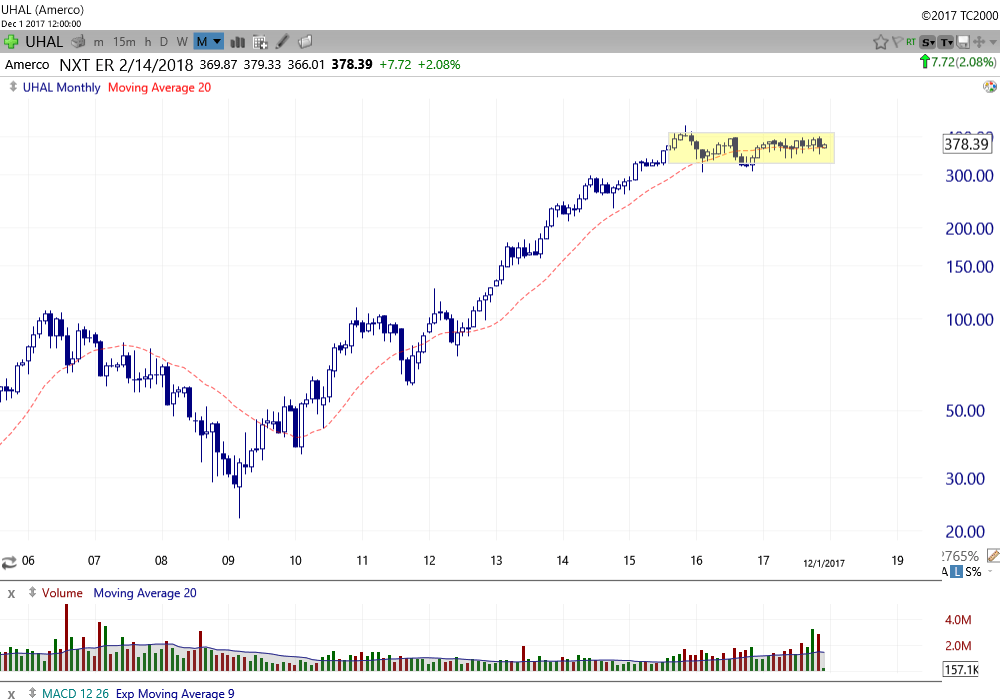
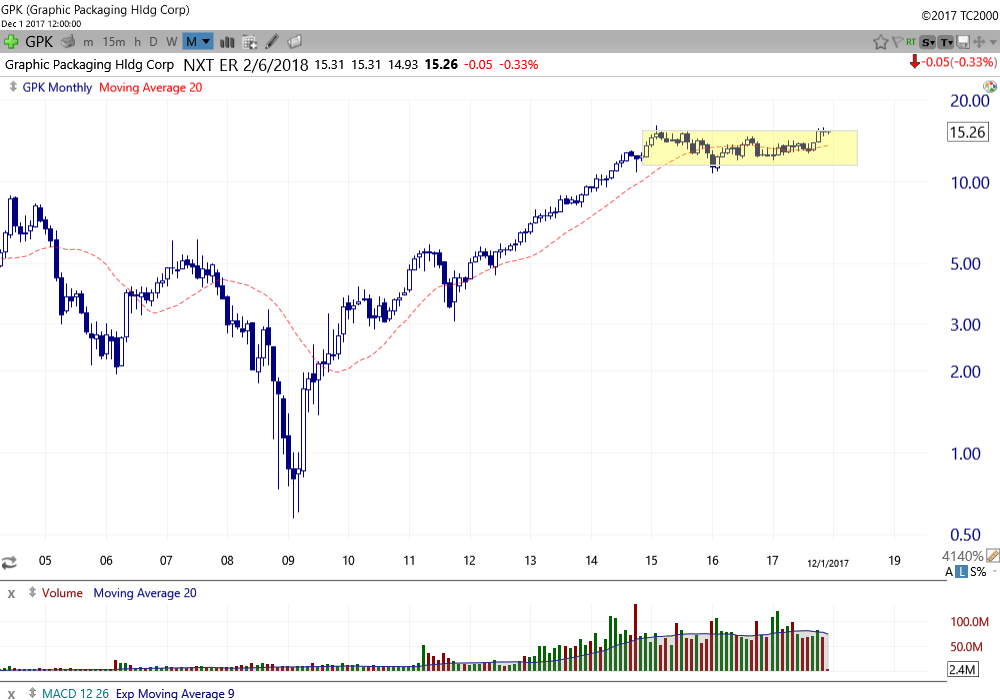
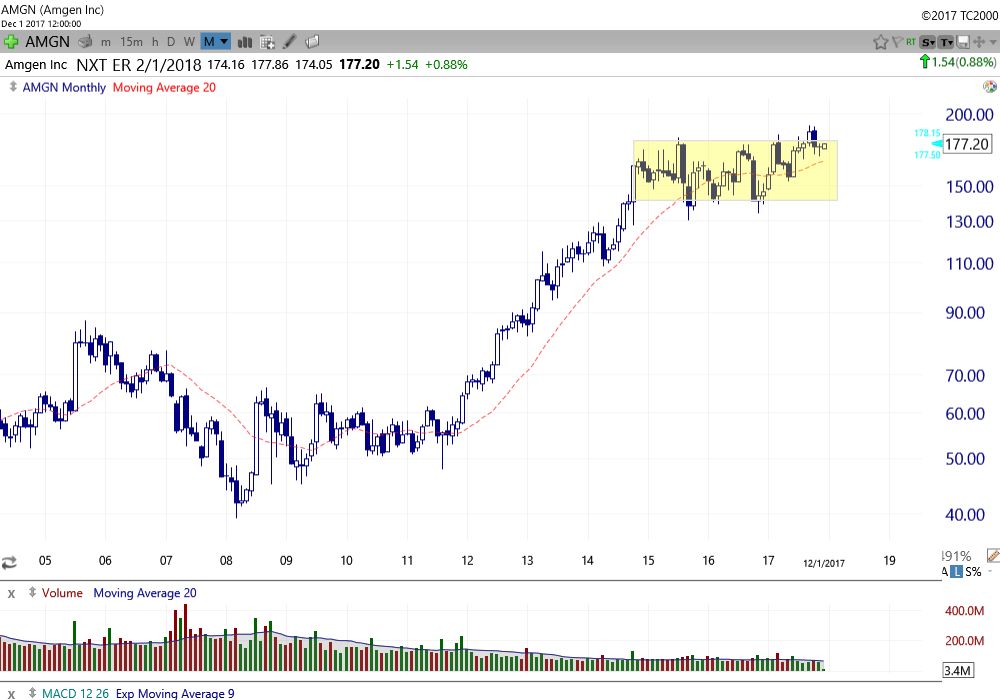
 And here’s one I currently own and bought slightly after the breakout from the base:
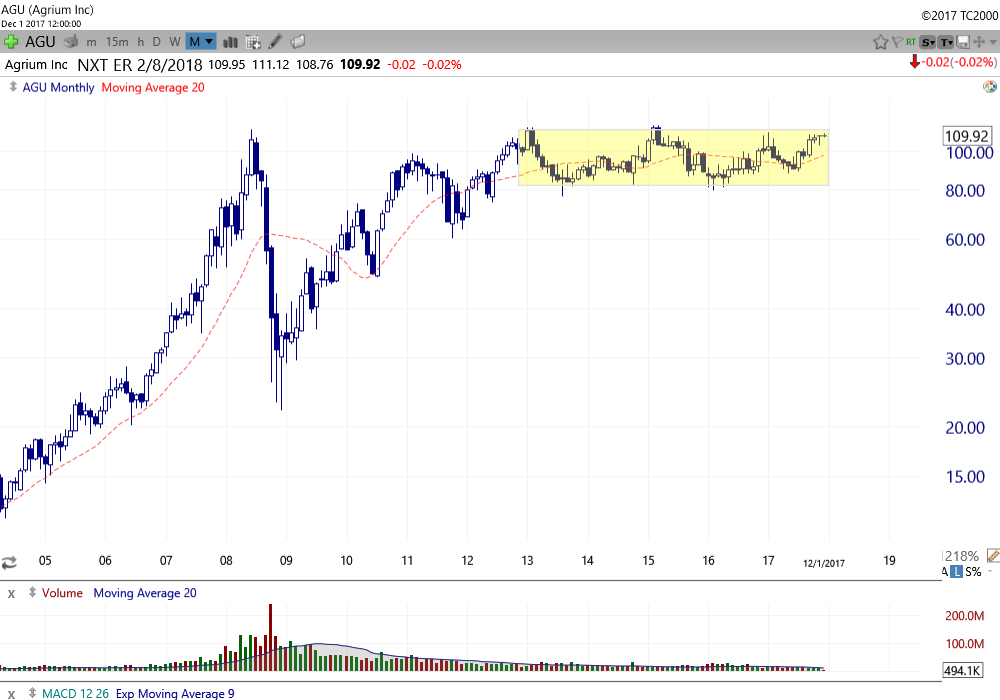
OK. Now we have some examples of the big moves that can follow these consolidation breaks. These are easy to identify in hindsight. But the trick is identifying them in real time and profiting from them. One of the nice things about playing these types of moves is that your timing doesn’t have to be perfect to capture some nice gains. You don’t have to catch the breakout the minute it happens. I use a shorter time frame (daily chart) to time entries and exits so I’d wait for it to setup properly before entering. Also, I don’t get too hung up on the symmetry of the pattern. It looks good when you can get it, but if you are waiting for perfection, it’s easy to miss some nice moves. Here are a few charts that have similar patterns to the examples above that may be ready to break out:
These are a few I’m keeping an eye on. For a bigger list be sure to check out TTPTrading.com. Our early bird membership rate of $69/month won’t last forever!
On a side note, I’d like to mention I recently switched to TC 2000 for my charting software and couldn’t be happier so far. Scanning stocks for bases and patterns like those mentioned above can be done 10-20X faster than I could previously do. That means even more charts!
Have a great weekend everyone.
