All,
Hope you are having a nice weekend. I’m taking a break from my typical posts here so bear with me. I wanted to take this time to discuss two huge stocks and some trouble I see currently. I’m talking about Apple (AAPL) and Microsoft (MSFT). These guys are monsters. They make up a whooping quarter of the weight in the popular Nasdaq 100 ETF (QQQ) and about 12% of the S&P 500. Looking at their performance over the last five years it’s easy to see why. Check them out compared to QQQ, SPY and poor small caps (Russell 2000 – IWM ETF).
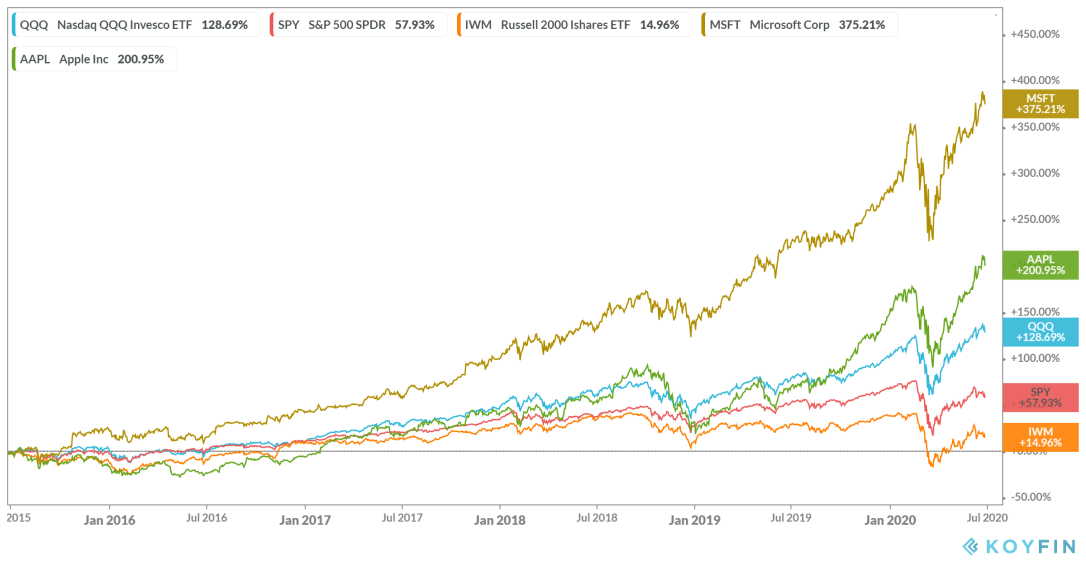
These guys have been true beasts. MSFT up 375% and AAPL 200% over five years. Huge out performance from these names that many of us have benefited from. Directly by owning them or indirectly by owning the ETF or mutual funds they are heavily represented in. Can they keep this up? Of course they can…but I’m just not so sure right now is the right time to join the party.
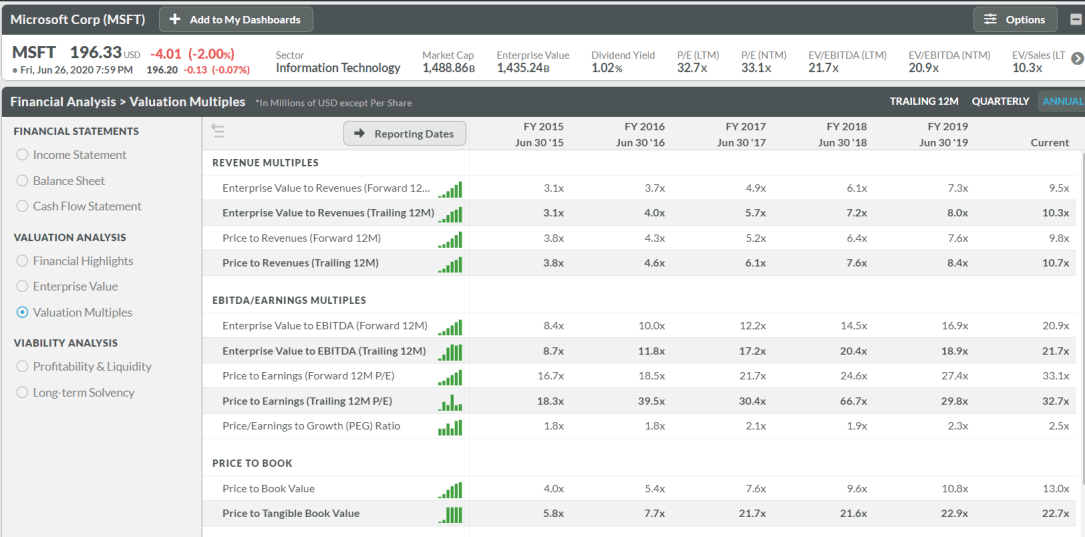
Again, I’m taking a different approach from my normal posts here to look at some fundamental data. I can’t believe I just said that! I would never buy and sell off of pure fundamental data as in my view price action captures everything I need to know for the buying and selling of stocks and provides a level of risk management that fundamental data never could. However, I don’t think this data is meaningless. It’s just not trade able. Unless the charts match up. I’ll get to that in a minute but first, just look at these valuation trends in AAPL and MSFT for the last 5 years from Koyfin (which is an awesome tool by the way):

So to sum up AAPL you are basically paying double right now for sales and earnings as you where in 2015. Here’s MSFT:
 Similar story. Is growth really going to accelerate that much in these names? Maybe. Maybe not. Now, let’s get to the good stuff. The charts. I use TrendSpider for all of my charting / trading needs.
Here’s a chart I posted Friday of AAPL. It’s a weekly chart with a 200 period MA and RSI (momentum indicator – I know. I usually don’t include this on my charts either) at the bottom. Notice how the last couple times AAPL was extremely extended from it’s 200 period average here on the weekly chart and losing momentum, it had some pretty substantial pullbacks. We are at that point again now and printed an ugly candle for the week right at the top of the channel. Yikes.
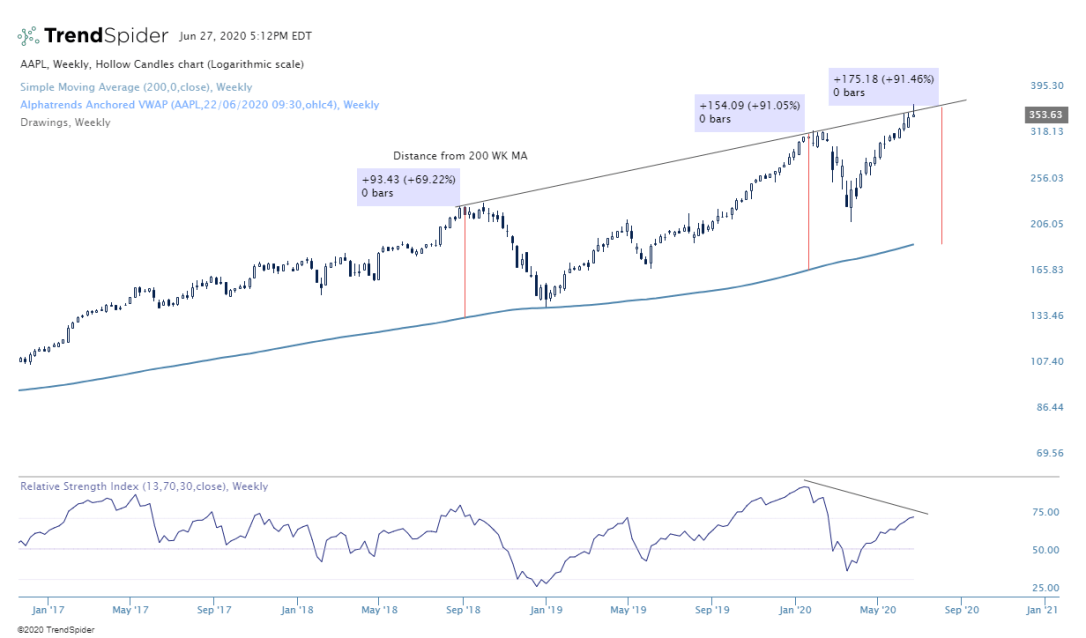
Zooming in on the daily, we can see momentum diverging as price made a recent new high. It’s also looks like it wants to break that uptrend line from the March lows. I think it’s very possible we retest those highs from early this year around 325 (yellow highlight) soon if next week doesn’t get off to a good start. I always hate projecting where prices are going to go though as anything can happen and in the end I have not idea. What I do know, is AAPL (and by default some major indexes) looks vulnerable here. Full disclosure, I own puts expiring in August in AAPL. If the price snaps back up and reclaims the high from this past week, I’ll get out while I have plenty of time and take my losses. It happens.

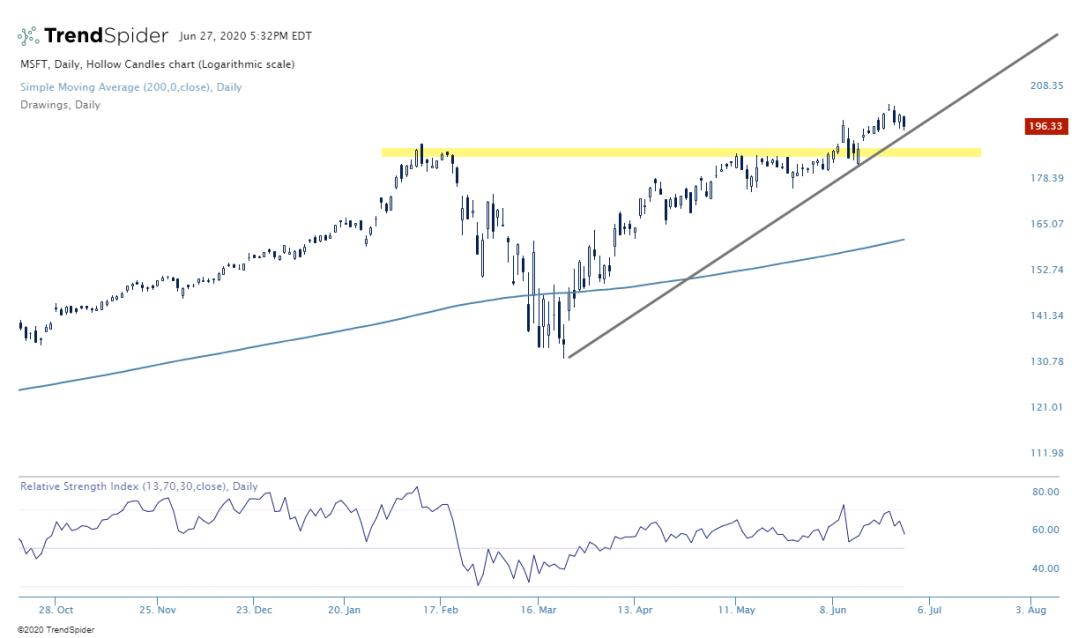
No let’s take a look at monster #2. MSFT. See the weekly chart below showing similar characteristics as AAPL. Very stretched from the mean. Momentum not confirming new highs and a nasty candle to close out the week. Looks similar to that February candle right before you know what and the big pullback.
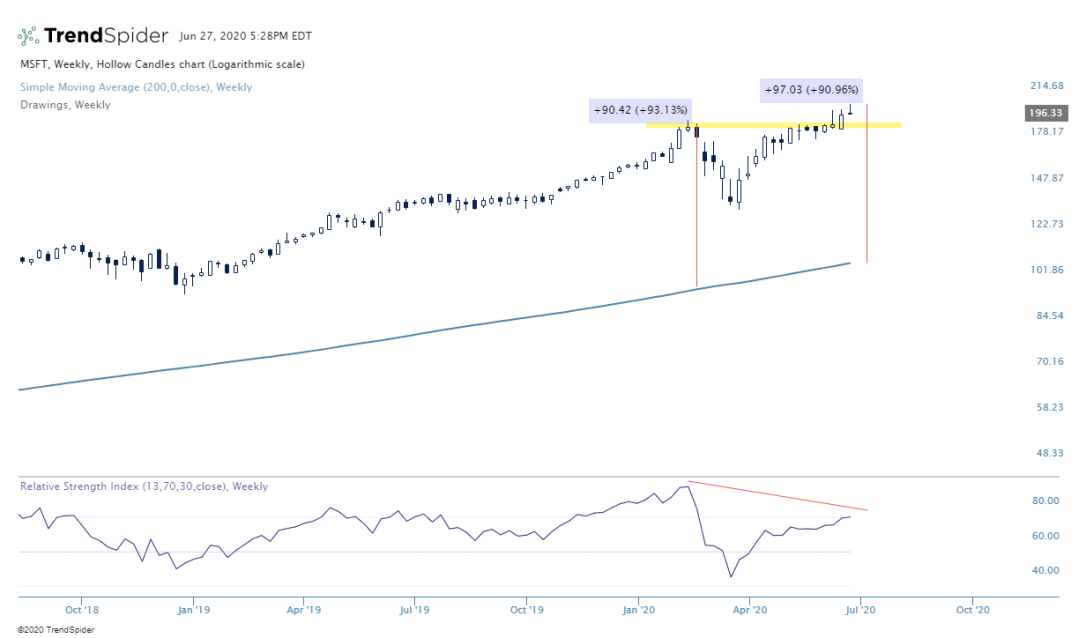
I have no MSFT position currently but I’ll be keeping my eye on the daily. The uptrend is still holding and the level just below 190 looks like a logical area where it might find support if it starts turning down. Actually, if it did find support here and start bouncing would be a very nice risk / reward entry on a long position. That’s why I love trading from charts! You can be flexible and change your mind if price takes you in another direction. However, I do have concerns here highlighted above but to get me to get short MSFT, I’d have to see it take a trip below the yellow area below.
Thanks for sticking in there while stretched from my normal posts. Check my Twitter and StockTwits fees for my typical ideas. Just wanted to share some thoughts and concerns I have with these giant stocks. If these do start turning down, there will be some major implications. As always, I’ll follow price but the fundamentals here provide some additional context and if these do start selling off it may be painful.
Before I forget, TrendSpider is having a great sale for 4th of July which has already started. Huge savings on their already competitively priced plans. I’m a huge fan of their always improving platform which has some really cool / unique features (Raindrop charts, awesome scanning and back testing, etc.). They always offer a free trial so it’s a great time to take them up on it if you are curious. Click here to get started: