Hello,
I hope you are all good. I’ve done some homework this weekend and wanted to share some thoughts. To be honest, I think a lot of index charts (excluding the NASDAQ) look vulnerable here. This includes indexes here in the US and various indexes across the world. I’ve looked at a lot. Most have experienced nice recoveries recently from the lows, but in my view the long term trend is not up. At least not yet. The summer months aren’t typically the best for markets either. So, if you are a more passive investor and saw your plans for the next 5 years get crushed as the markets crashed keeping you up at night worrying, but were wise enough not to panic sell, you’ve now recovered a good deal of your losses. Before getting too confident that the market’s are “back”, in my opinion it might be a good time to review your allocations and see if your weighting in equities are lining up with your goals and time frame. You probably don’t want to revisit that feeling you had in March so this bounce is a potentially a good opportunity to re-evaluate things. I’m not saying we are taking another trip to the lows or lower but I think this definitely needs to be considered as a possibility. This is just my thought. I’m NOT a financial advisor.
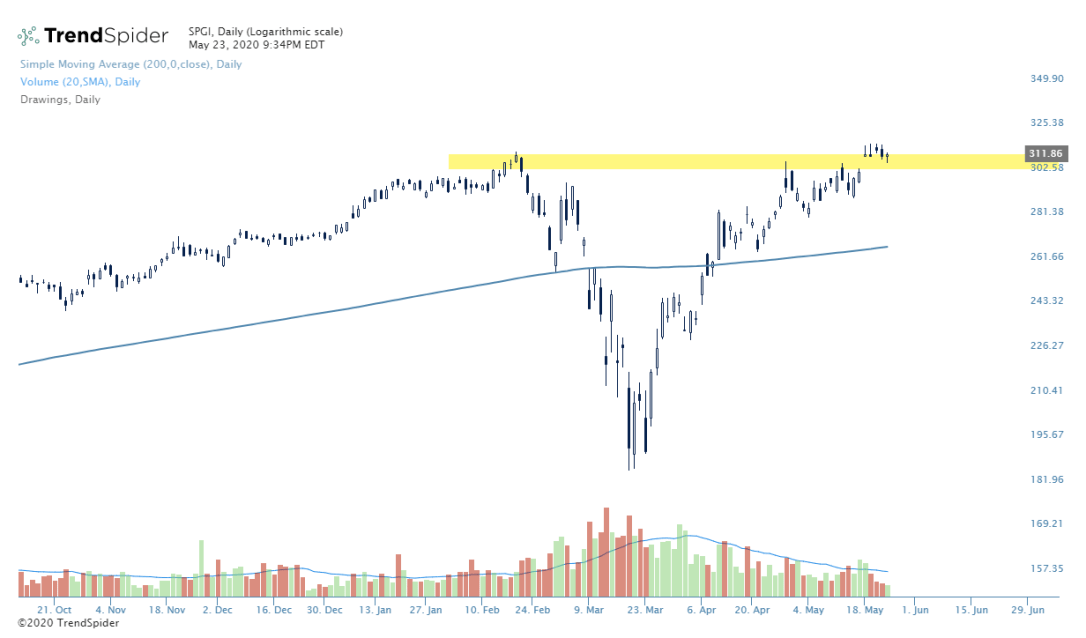
The S&P 500 provides a good example of this. Here we are after a strong bounce but we are coming right into the 200 day / 40 week which has proven time after time to be important. This also lines up with the highs from last summer (yellow highlight) which may have some price memory and potentially act as resistance. Here’s a look:

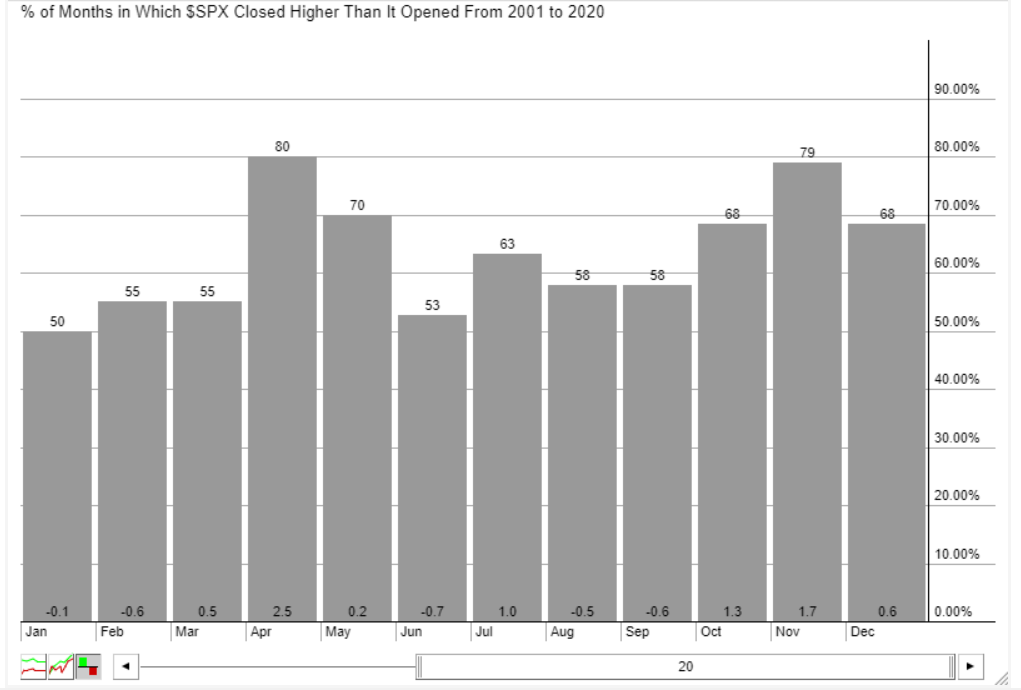
And here’s the seasonality in the S&P going back 20 years from StockCharts.com. June has been up 53% of the time and the average return is the lowest of all months at -0.7%.
So those are just some general market thoughts. In summary, I’m a bit concerned. Valuations are generous to say the least based on a number of metrics and perhaps this strong rally is providing investors with a false sense of security.
Indexes aside, there are areas of the market that look great (i.e. so many Tech names continue to look strong). My current portfolio is focused on owning these companies in uptrends mostly trading near all-time highs. An exception is Boeing which I added last week along with MJ (Marijuana ETF) which aren’t near highs but the risk / reward looks favorable in my view in the coming weeks. My exposure is mostly long in strong stocks and my largest holding is currently GDX – the gold miners ETF. Given the vulnerability in for the S&P, I also recently purchased SPY puts expiring in June and July. Not huge size on these but I’ll add if we start moving down.
Being able to move quickly and actively manage your portfolio is a huge advantage us individual investors have. No need to perform any super in-depth analysis. We can just focus on names with charts presenting nice risk reward setups, enter positions, and use stops to get us out if price proves our entries wrong. So simple in concept but not always in execution. Trust me. I know.
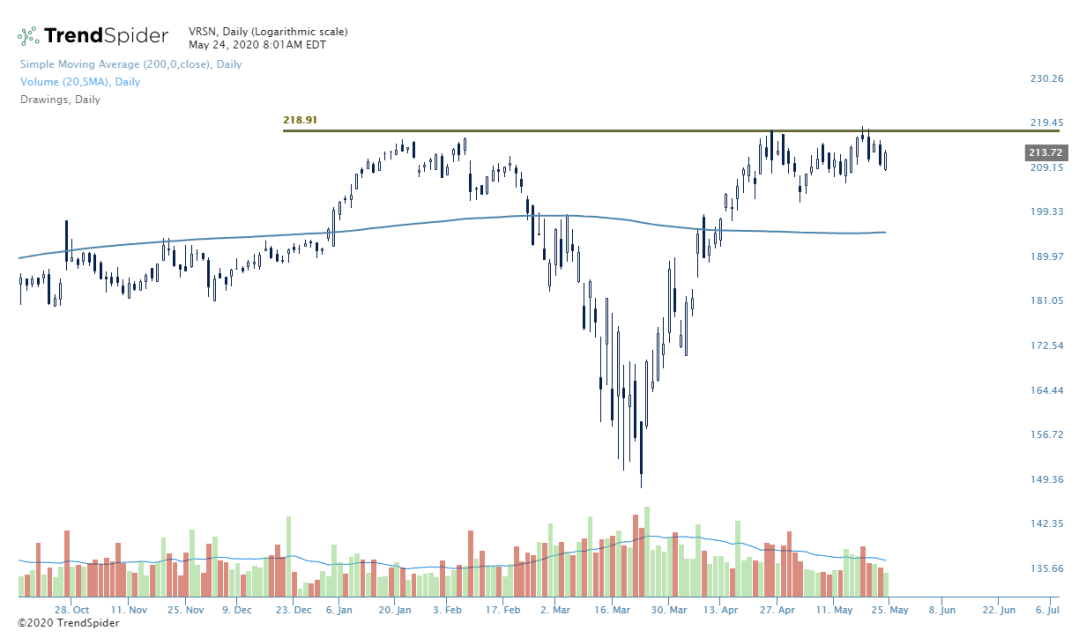
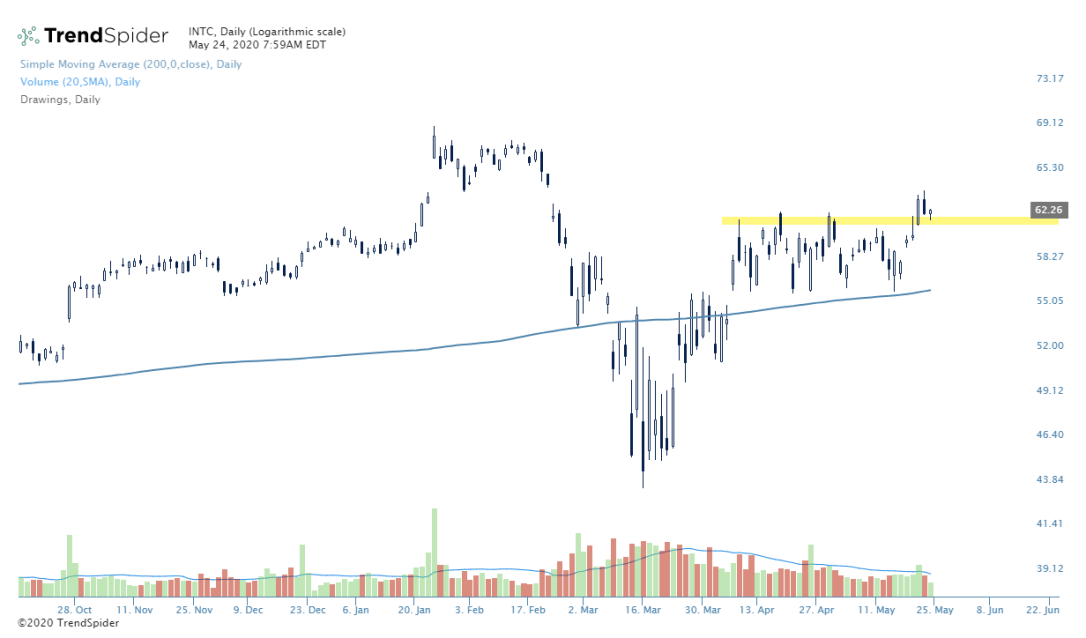
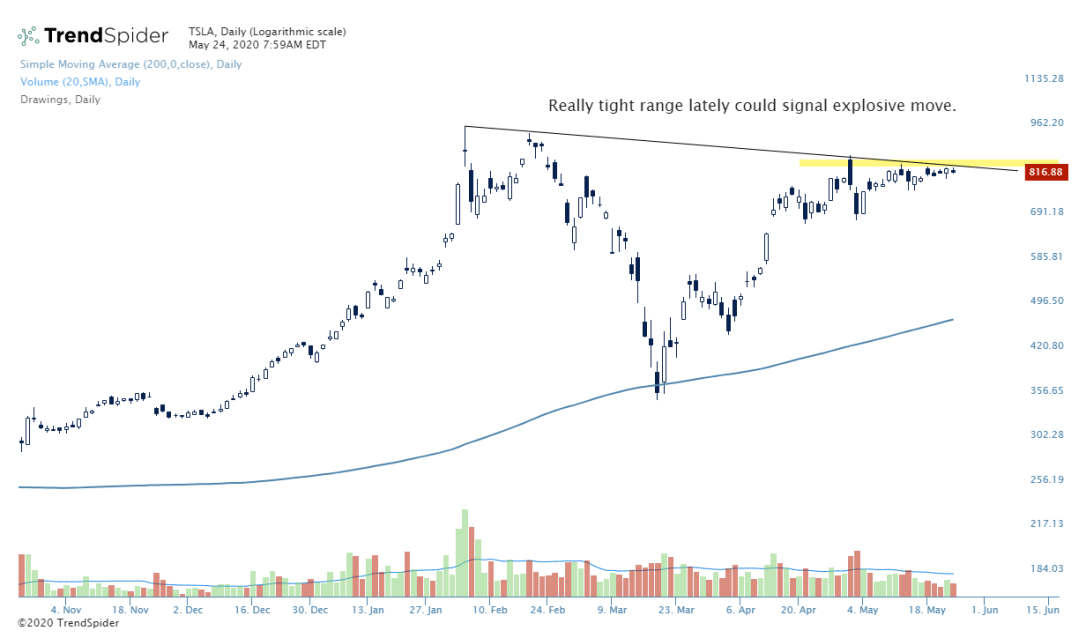
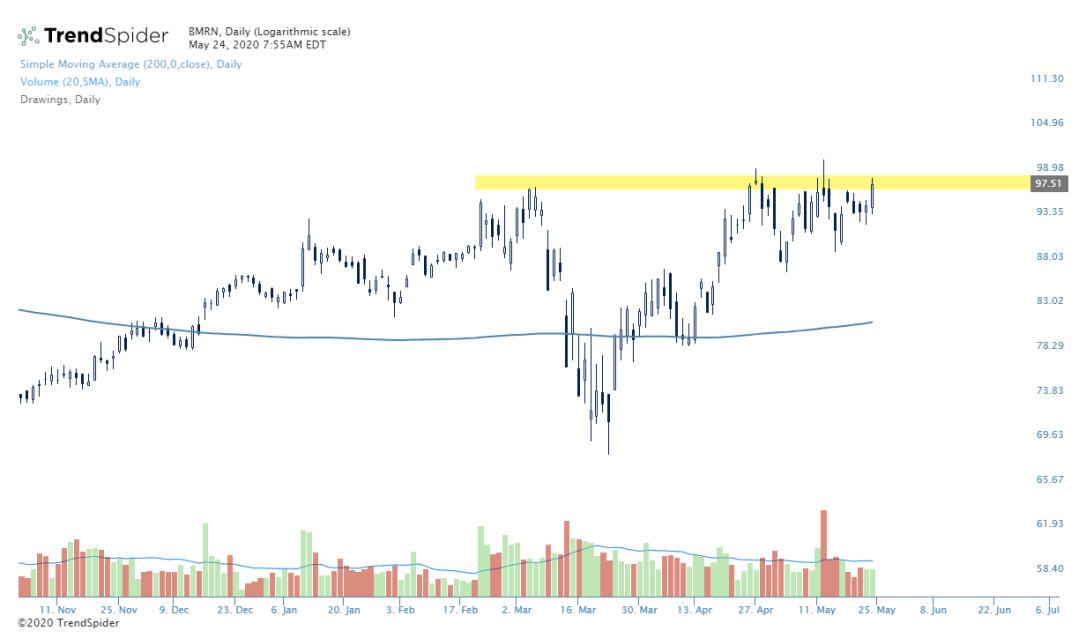
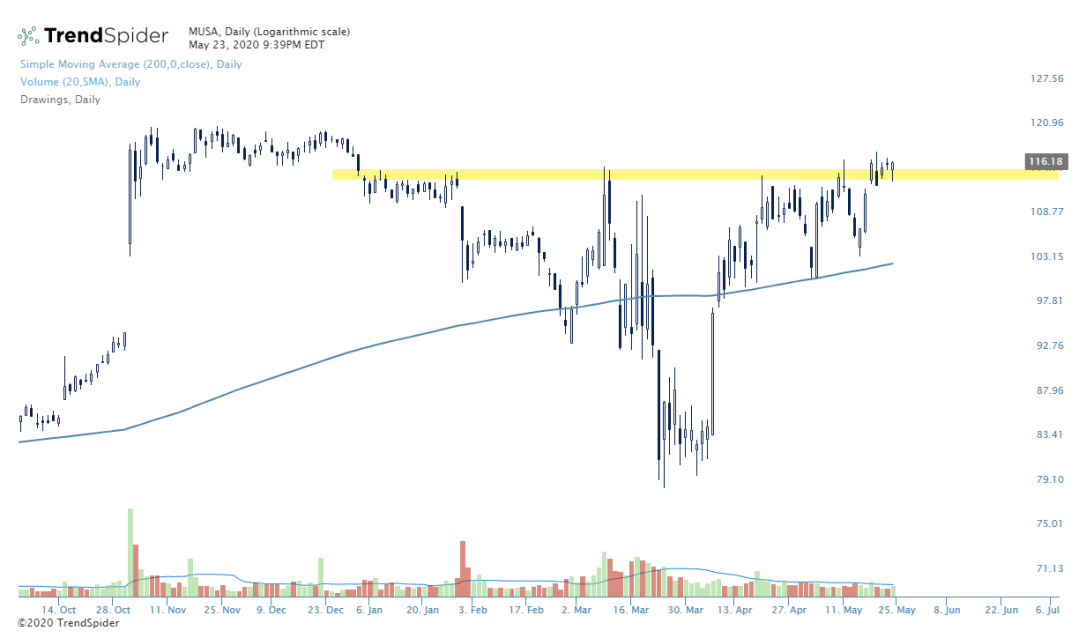
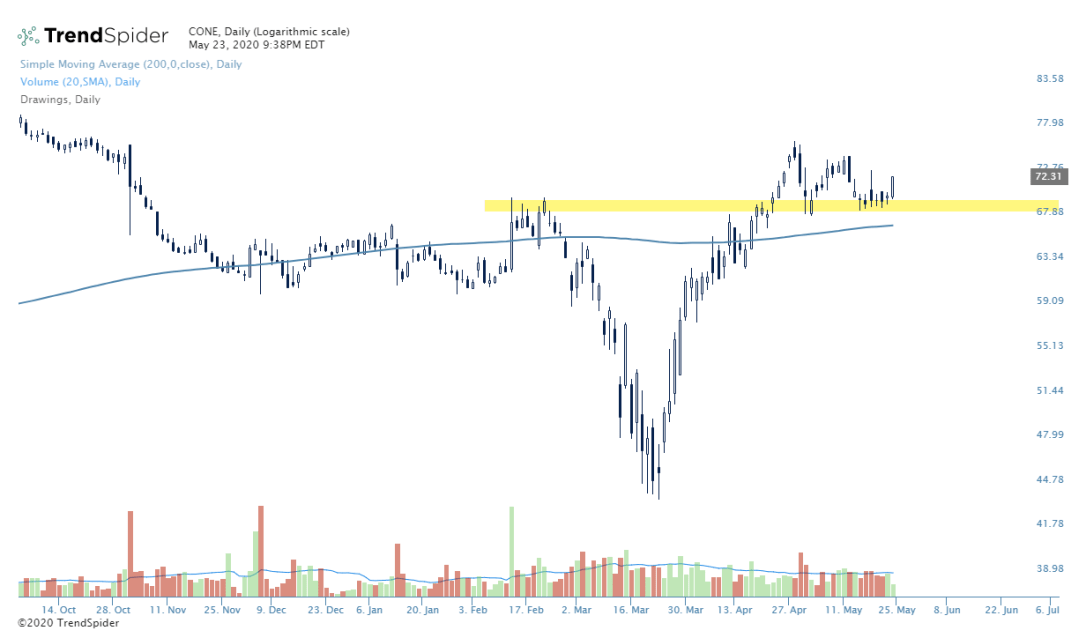
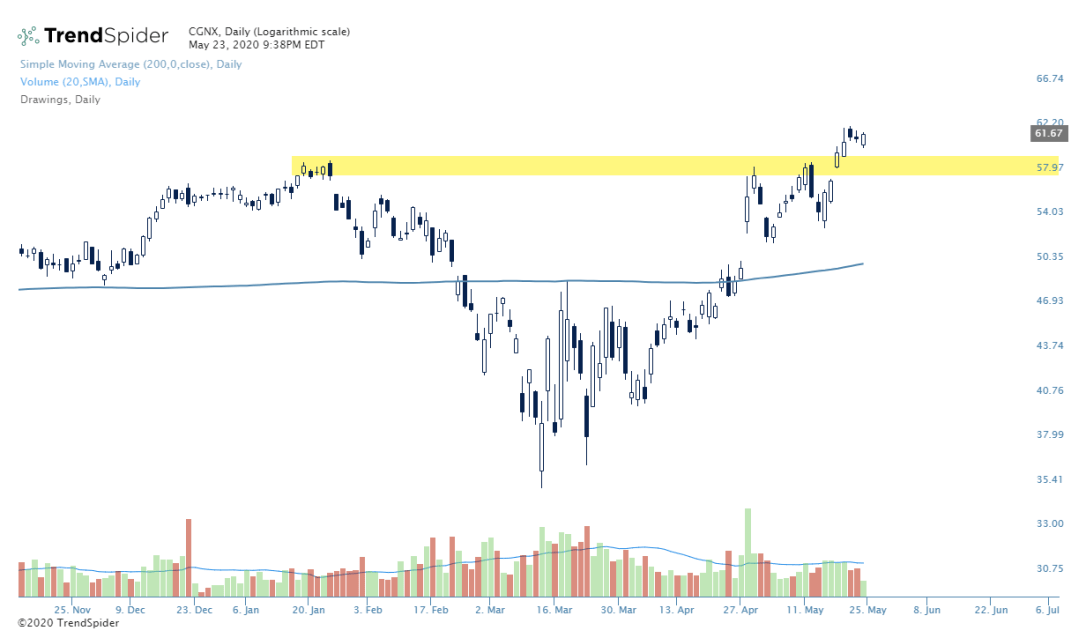
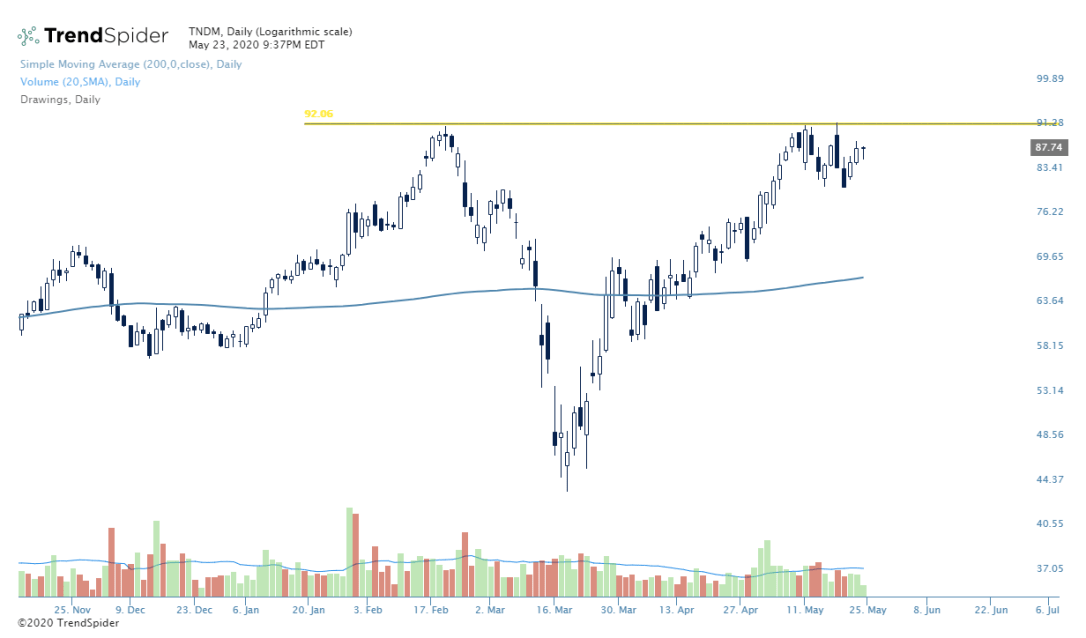
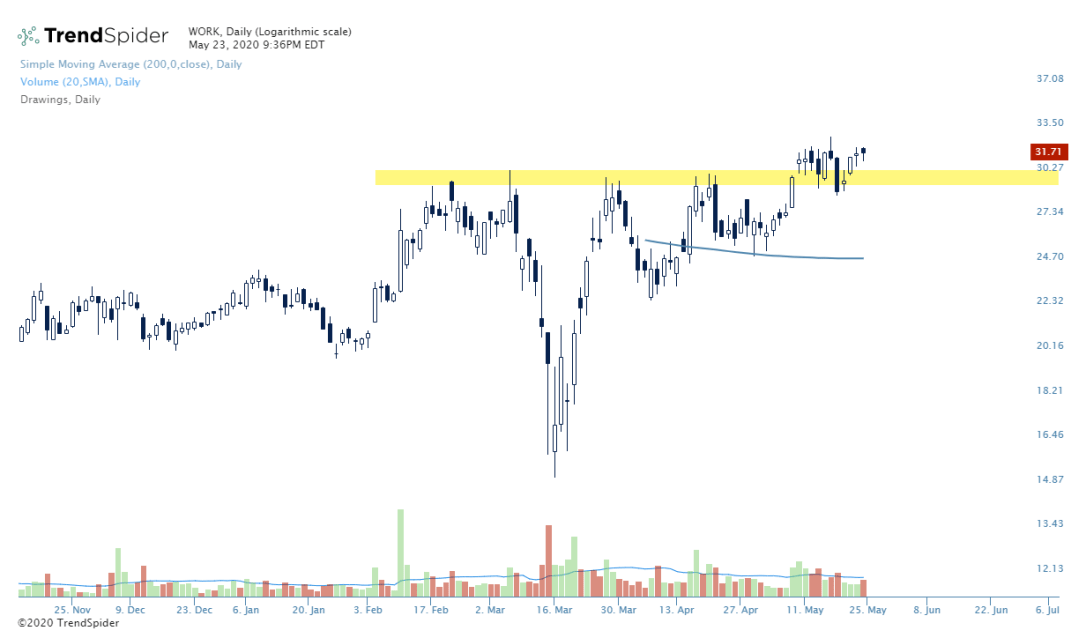
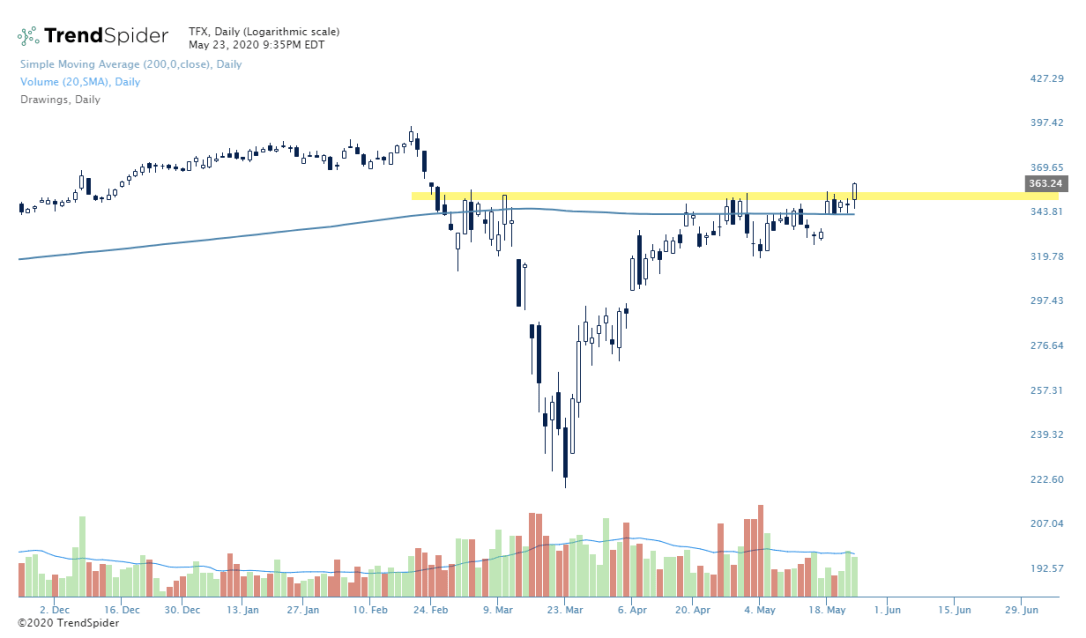
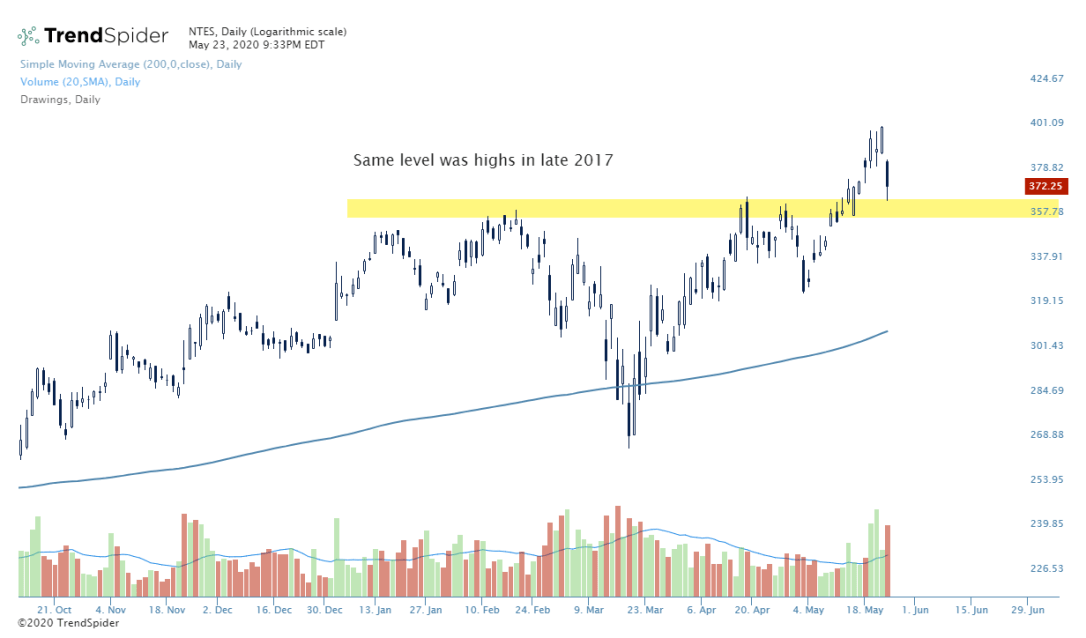
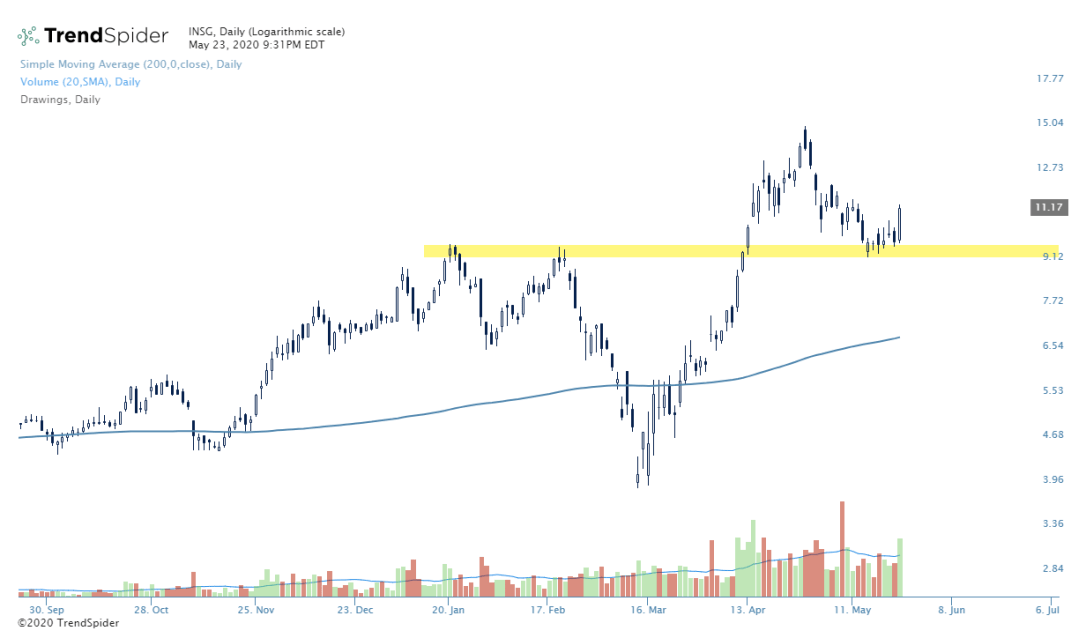
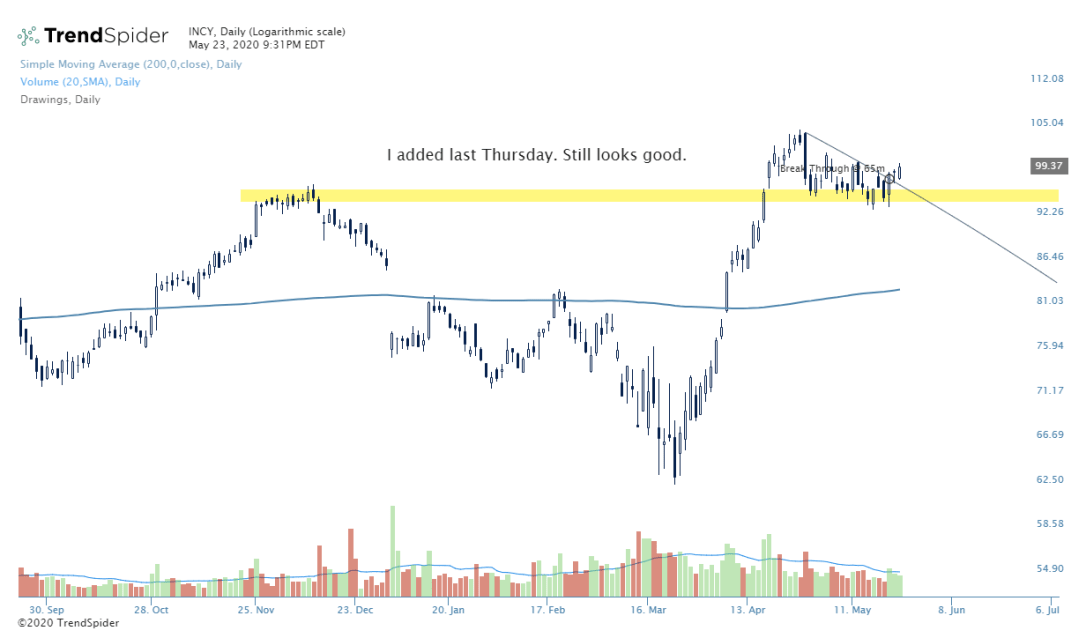
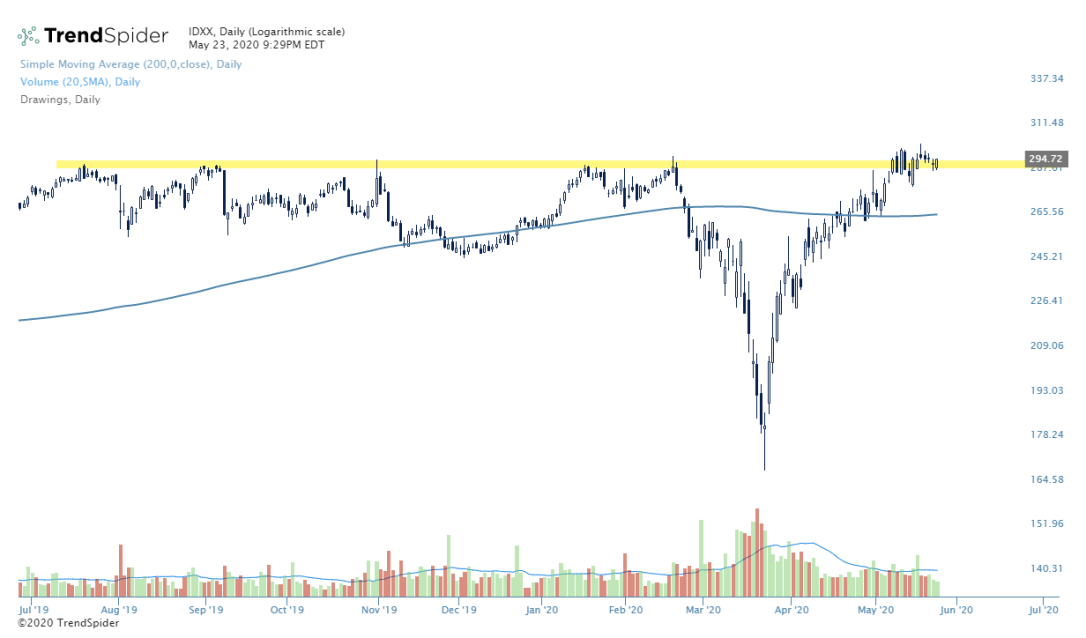
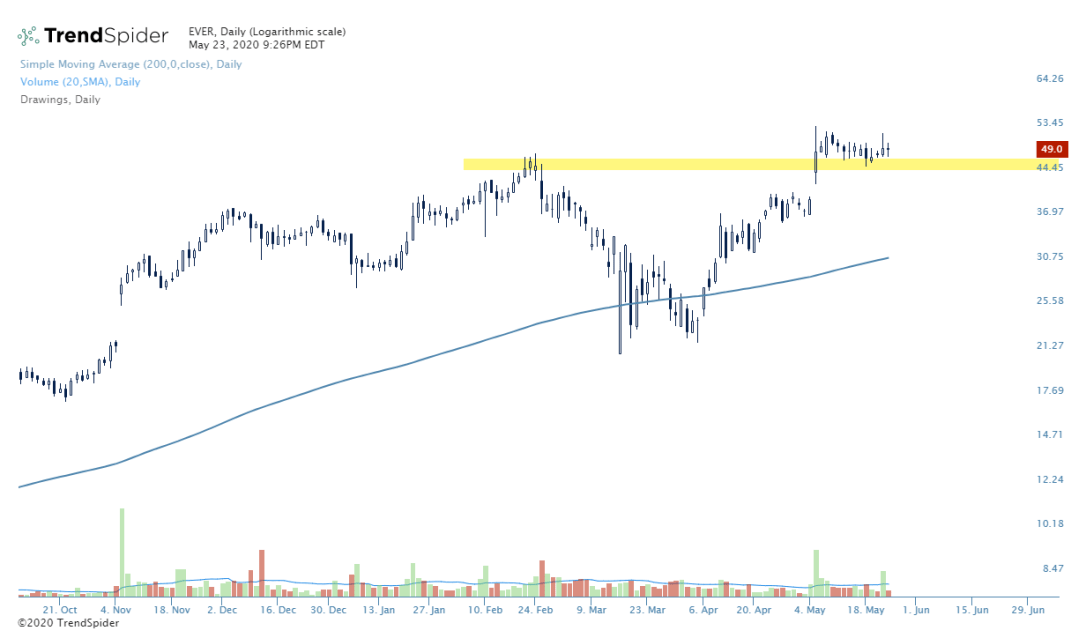
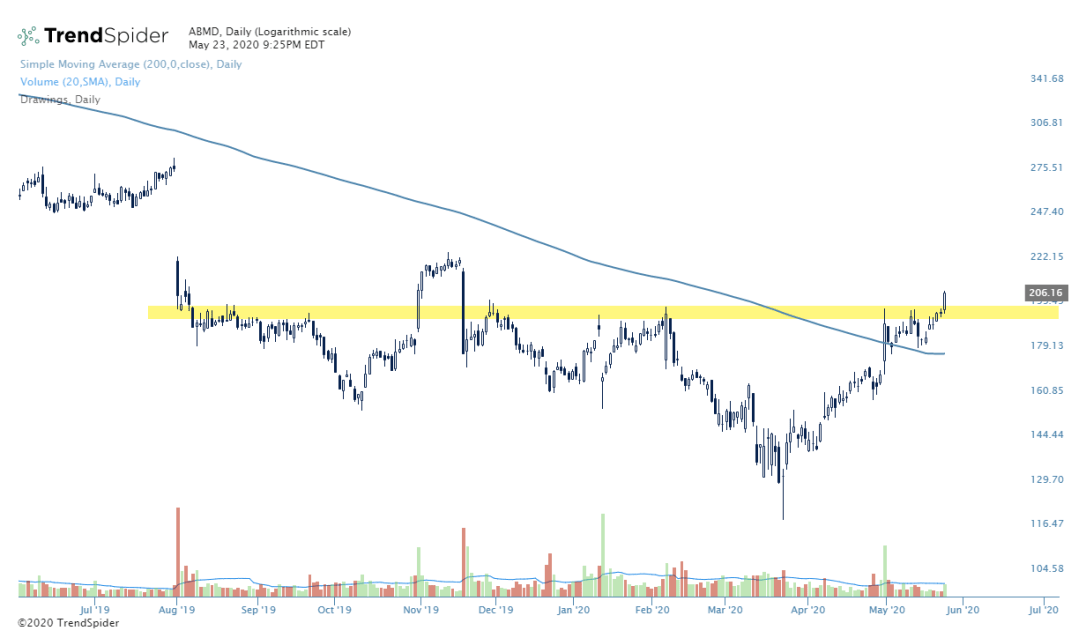
In any case, I wanted to share a number of charts I like coming into next week. As usual, I’ve highlighted key price levels in yellow. I like these names as longs above these levels only. Not below. I work full time and don’t always have tons of hours to spare on the weekends between family time, cleaning out garages (not fun!), etc. So I appreciate help identifying quality stocks. And that help is in simple scans I use to help generate watchlists. Most of these names were found using a scan I use in TrendSpider (see below for a great deal they have going on right now) identifying stocks trading above their 200 day SMA and with an uptrending 21 and 55 day EMA that aren’t extremely overbought (based on RSI). I still like to eyeball all charts, but this simple scan saves a ton of time ensuring I’m only looking at stocks in established uptrends. I look for potential breakouts from horizontal price levels or retests of those levels. Simple. Here are some I have my eye on:
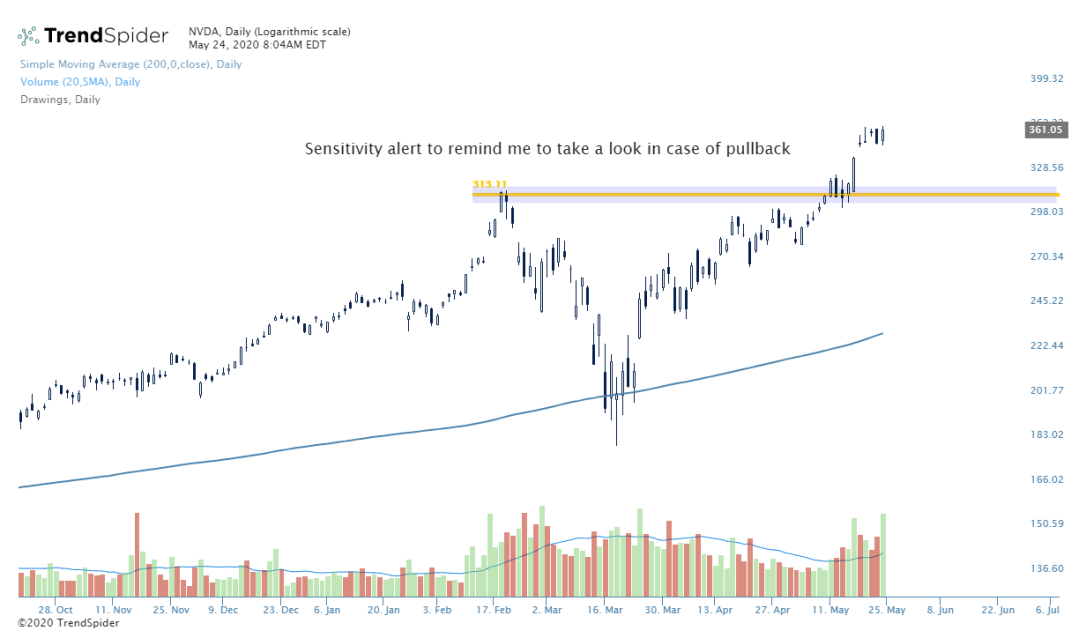

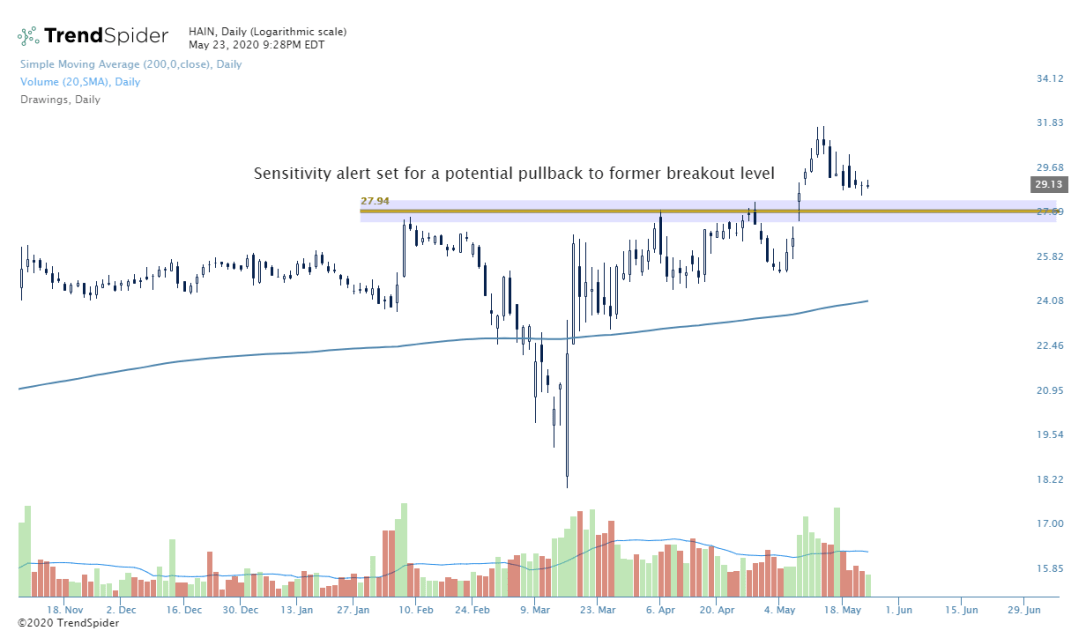
 You’ll notice in the first chart above, NVDA, price has already broken out. In cases like this, I love the sensitivity you can add to alerts in TrendSpider to alert me if price pulls back to a general area. Support / resistance isn’t typically an exact price level, more of a general area. Here’s another example of that in an alert I have on HAIN. This was on my radar and I was alerted of the breakout yet never bought. If it comes in for a retest, I’ll be alerted via text and email to let me know:
So those are just some I’m watching of next week and some market ramblings (thanks for sticking with me). Hope you find it helpful. As briefly mentioned above, TrendSpider is having a Memorial Day sale this weekend with a 35% discount. This is a really good deal on this awesome platform that has become so important to my analysis. Their alerts, scanning, and backtesting features (just to name a few) are outstanding and save me tons of time and help make me make the best possible decisions. I have no hesitation in recommending their product. As always, you can try it for free before making any commitment. Here’s a link to their sale – TrendSpider Memorial Day Sale