
Wow. What a month. Huge moves within a 30% trading range on the S&P. Circuit breakers. A health pandemic. Really unprecedented. But now what?
No one knows. Especially me. What I do know is that all this volatility isn’t a typical characteristic of a healthy bull market. Perhaps it needs some time to chop around and find it’s footing or perhaps the other shoe is going to drop soon. Perhaps in a big way. I’m not sure but I don’t think there’s anything wrong with playing a little defense here. Stepping mostly away from the market (or maybe trading shorter time frames for those of us that are active participants like myself) in times like this can not only cause you to sleep better but can also be also help in compounding your money. But, and a big but here, that’s if you only get back in as we all know the compounding effects the stock market has on money over long periods of time. Of course the next question for a more passive investor is when do you know when to get back in? That’s a tough one. No answer is perfect of course and all markets are different so what may have worked in the past has no guarantees of working again. But I think a decent answer is you get back in when the market starts trending up. Seem easy enough but is far from it as different individuals look at different time frames and market stats. I did find one super simple indicator that can help identify when markets are trending up and when you want to be riding that trend. See the S&P 500 chart below:
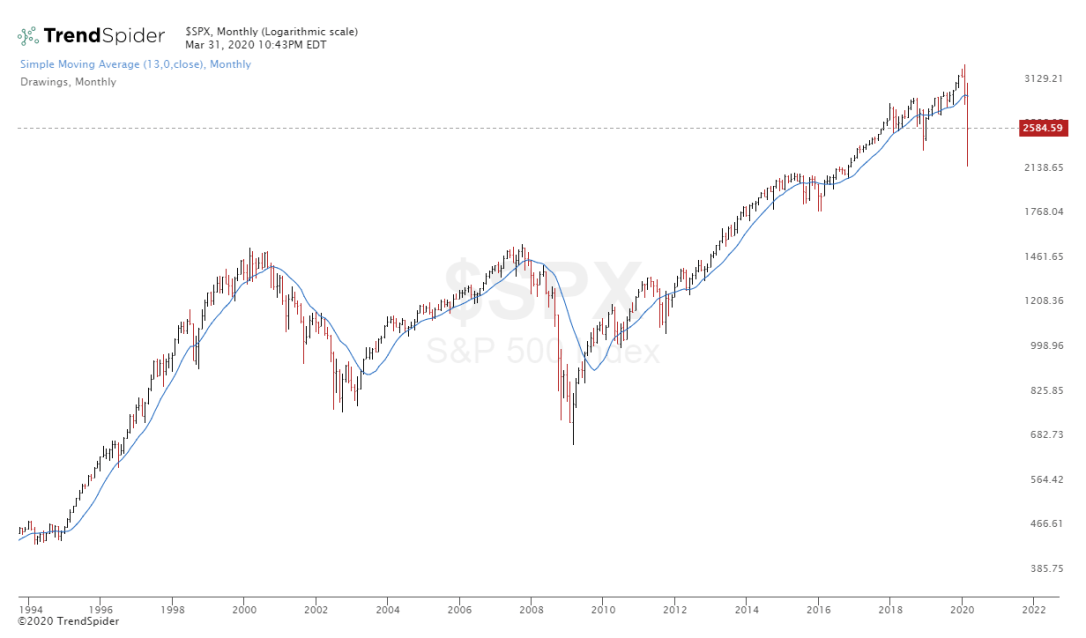
See the blue line. That’s a 13 month simple monthly moving average (MA) going back to the mid-90’s. A 12 month on one here gives about the same look. I use 13 because it’s a fib number and because I like it. In any case, what’s apparent to me, is you can ride some major trends simply by playing offense (being in) when the trend / moving average is sloping up and play defense when it’s sloping down. With the close of this month, the slope has now changed from up to down. So this looks like a fairly good signal to answer the question when to get back in. It doesn’t get you to sell at the top or buy at the bottom but in this time frame, it looks to be an effective signal allowing you to catch the big moves on the way up and save you the frustration of the big moves on the way down. Looks can be one thing so let’s look at the actual signals based on the slope changes and historical performance to see if our eyes are missing something. TrendSpider has an awesome strategy tester (along with so many other great features) so I’ve used that function to test the results of buying the S&P 500 when the 13 month MA starts sloping up and sell when it slopes down (closing basis). Here’s the same chart showing all entry and exit signals:
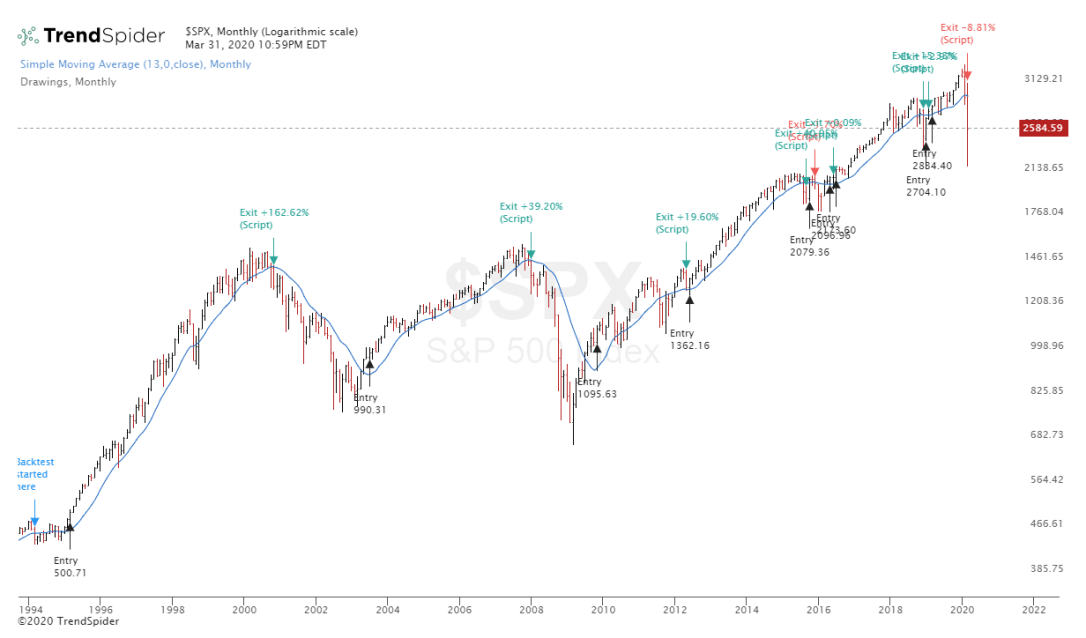
As with any test like this, there’s some choppiness as you can see a few of the signals clustered close together. It happens. Nothing’s perfect. The sell signal today resulted in a 8.8% loss from the last entry which was obviously helped by the nice bounce we had off the lows recently. Here’s the overall results:
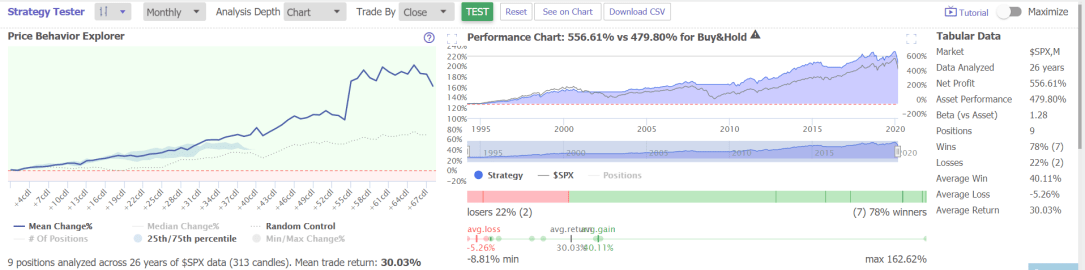
Pretty impressive! 9 signals over 26 years with gains averaging 40% and losses 5%. Performance better than buy and hold with far fewer headaches / drawdowns. 7 wins and 2 losses including the one from today. Of course this doesn’t consider if you went short or invested in alternative assets after the sell signals were registered which would enhance performance vs. buy and hold. So based on this history I’d say this is a simple and effective way to determine a re-entry strategy if playing defense. As I mentioned before nothing is perfect. I just wanted to share this to point out the sell signal just registered and the results of entering the market based on the buy signal.
Full disclosure – I’m blessed to have a great full-time job with a retirement plan that I contribute to regularly. Dollar cost averaging into the market is nearly impossible to beat over long periods of time. I recognize this and as much as I love trading, I don’t change anything in this account nor do I plan to anytime soon. However, I’m very active in other accounts (that don’t get consistent contributions) in attempt to outperform. Sometimes I succeed, sometimes I don’t. It’s a continual journey as many of you know. Bottom line, I’m playing some defense here based on market conditions in active accounts and this simple strategy is one of many pieces that can help tell me when to get back on O.
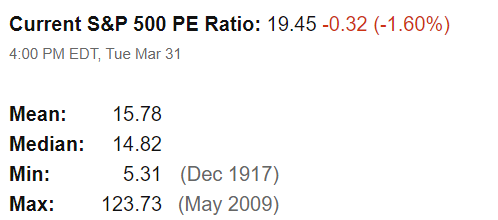
Oh. And if you think this recent fall from the highs provides value in the overall market I wanted to share this with you. The source is https://www.multpl.com/ which has some neat valuation tools. Here’s the current (based on S&P 500 earnings through Sept) PE ratio (data going back over 100 years) compared to historic averages:
Here’s the PS ratio (data back to 2001) which is probably more important in my mind:
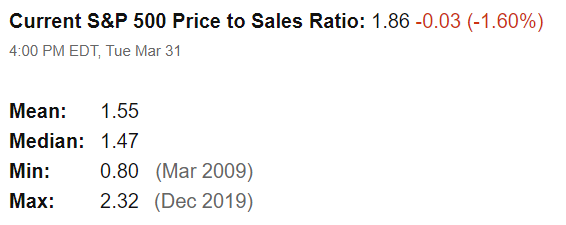
So even with this recent sell off we are at a minimum still 25%+ overvalued based on these common metrics. FAR from a bargain especially when you consider the denominators where from last Fall when things were looking much better. I’m a technical trader and have no issues with buying anything as long as the exit plan is laid out in advance. I’ve been buying some stocks lately but I’m also setting stops just under my purchase prices to get me out quick if wrong. Trust me, I’m wrong a lot but don’t mind the small losses. My purpose for uncharacteristically sharing fundamental data is just to show that I don’t think the market’s a value now by any means. I could have said the same at the start of 2019 while the market ripped higher as well. So fundamental data like the above are pretty poor timing tools and can’t be used for risk management but also show this sell off hasn’t given us a bargain and I think it’s wise to pick your spots and manage risk if you are active in the markets especially until things settle down.
Just my opinions. Thank you for reading and stay safe!
If you haven’t checked out the awesome tools at TrendSpider give them a try. They always offer free trials so no pressure. Here’s a link – TrendSpider
