
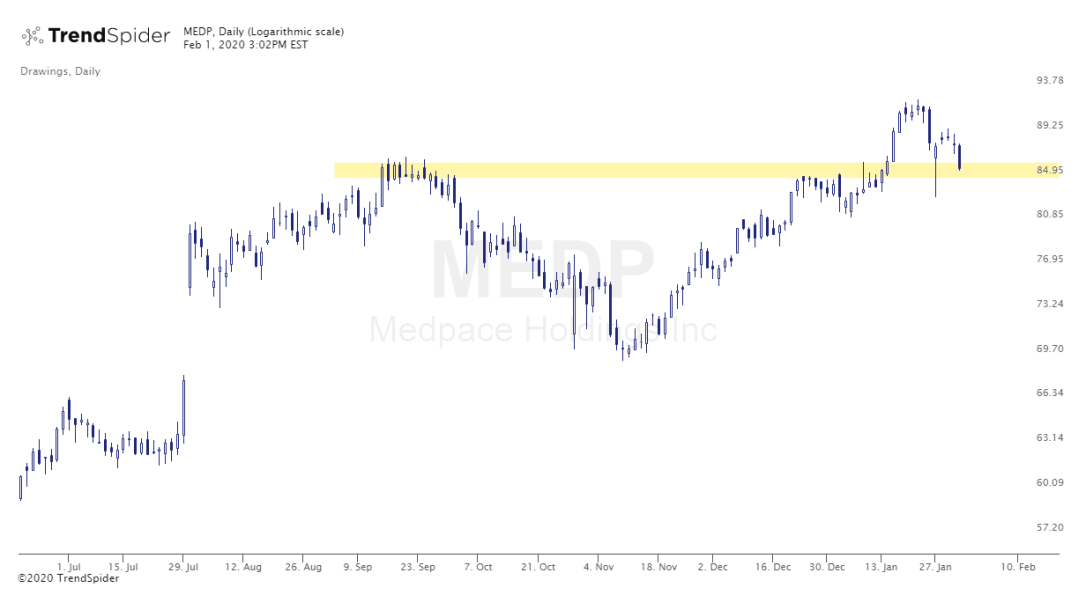
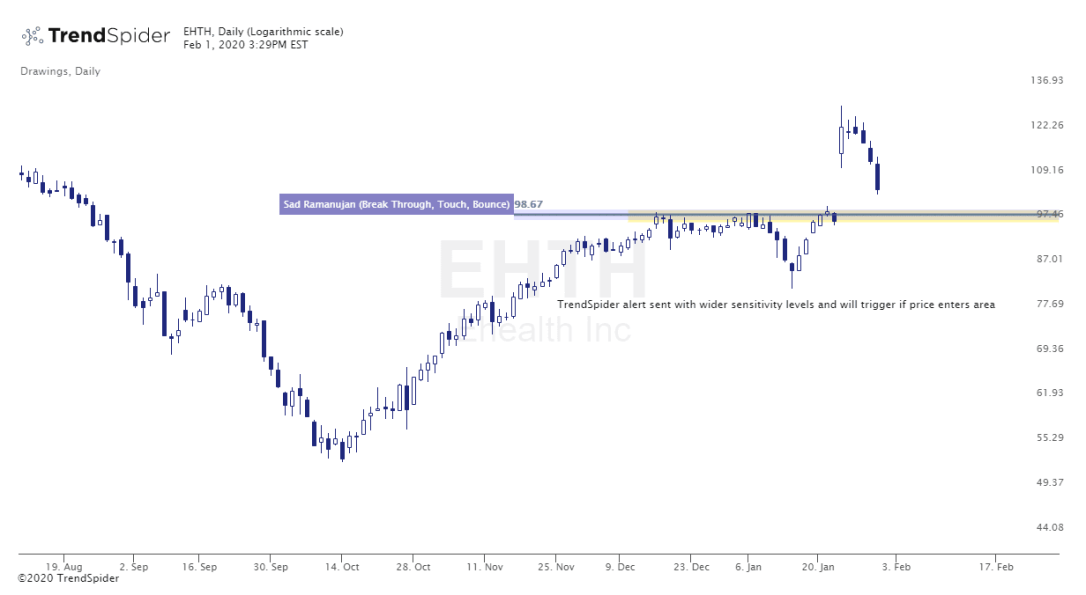
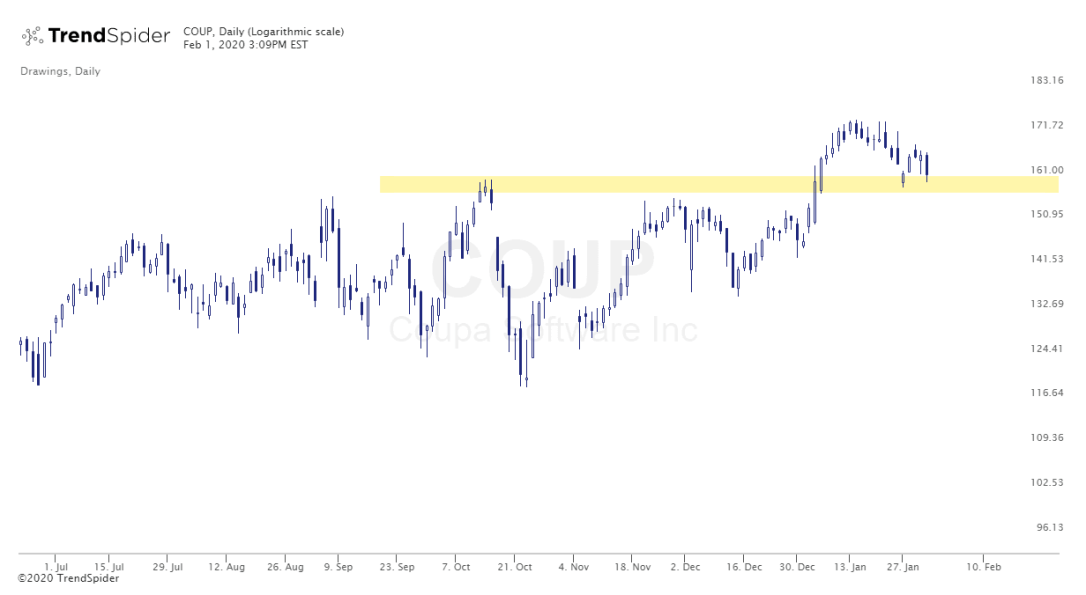
What a week we had last week! Finally some volatility and a good reminder stocks can go down too. We need that sometimes. I have no idea what next week brings but if you are like me, you may have been stopped out of quite a few names recently so have some cash now that can be put to work. As many of you know, I try to keep the majority of my entries as simple as possible. I like to buy breakouts of horizontal price levels and retests of those breakouts when price comes back to revisit the area. Given the pull back last week, I’m seeing a lot of nice setups developing retesting former breakout levels. Like they teach in Technical Analysis 101, what was resistance has a good chance at becoming support. Nothing is guaranteed though. That’s exactly why I like these type of setups. Either the price holds or does not. If your stop is set at the level where you know the trade is unlikely to work out than you get out without too much damage. So below are some of my favorite charts coming into next week. I only like these if the yellow highlighted levels hold. If they do not, these are no touches.
OK…now to the charts!
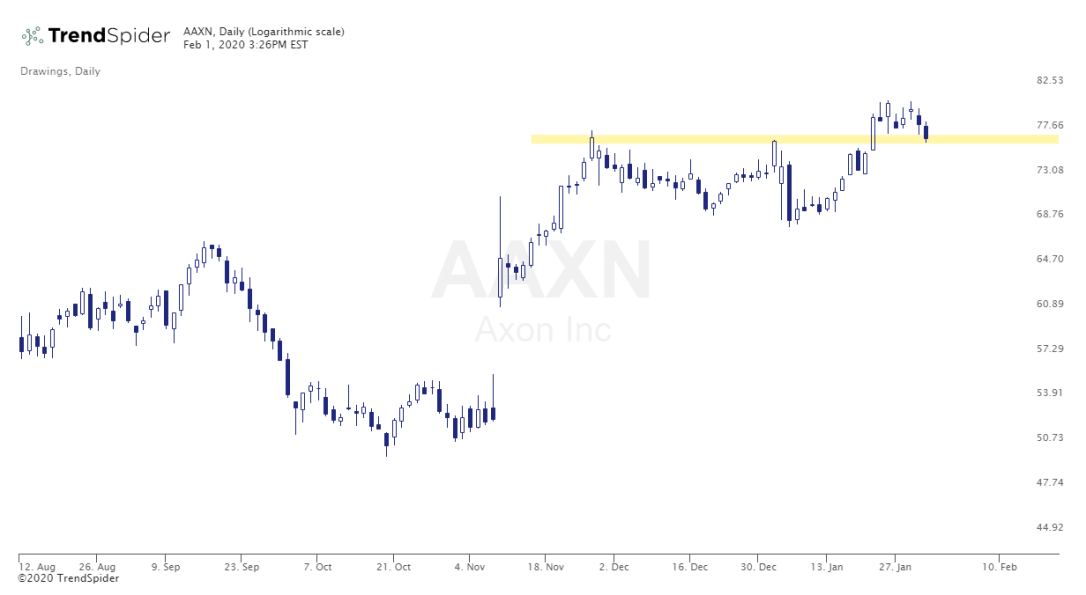
Here’s some pulling back to former resistance zones:
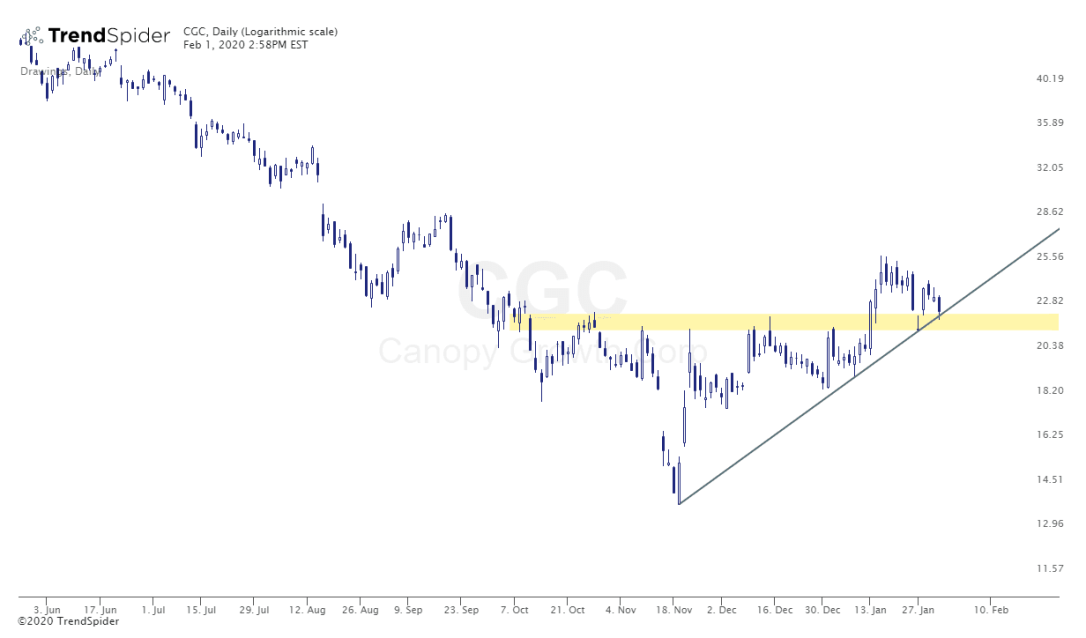
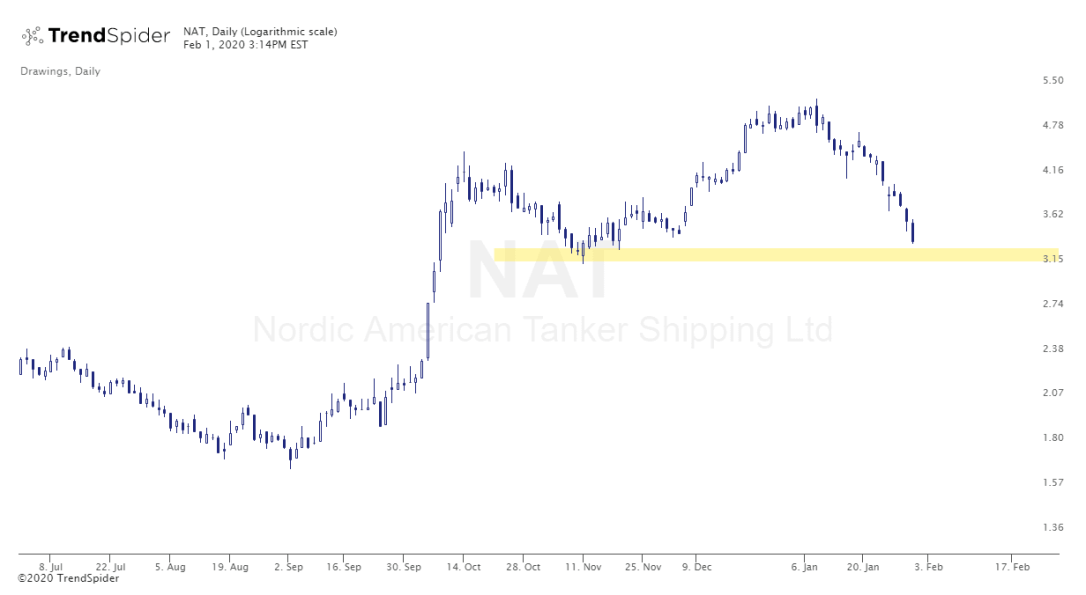
Here’s another one I’m interested in for a trade if this former support holds:
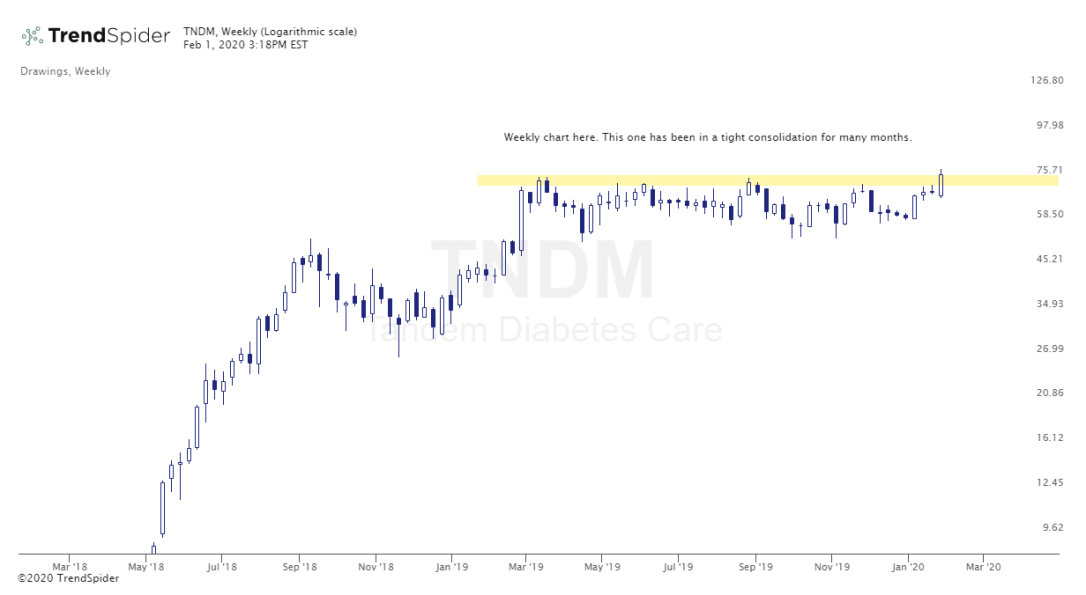
And how about this base breakout TNDM is working on. The weekly is shown here. Really pretty.
On a different note, if you haven’t tried TrendSpider yet I highly recommend it. The team there is great and they are constantly putting out new additions and improvements. The new scanner they just introduced is top-notch and they have some really cool / unique features. They offer a free trial so that’s a great way to try it out. Here’s a link – TrendSpider. If you decide you like it, feel free to use code “GRG15” to save 15% on plans.
