
All,
Typically, on StockTwits / Twitter I post a lot of trade setup ideas. I highlight key areas with a yellow box and like it as a long idea if price is above that box and vice versa for a short. However, outside of my posts on TTP Trading, I rarely discuss my thought process for the whole life cycle of a trade. That’s what I’m attempting to do here – the entry, holding, taking gains, and even adding more (which I did Friday). I will do this by showing what the charts looked like at the time key decisions were made.
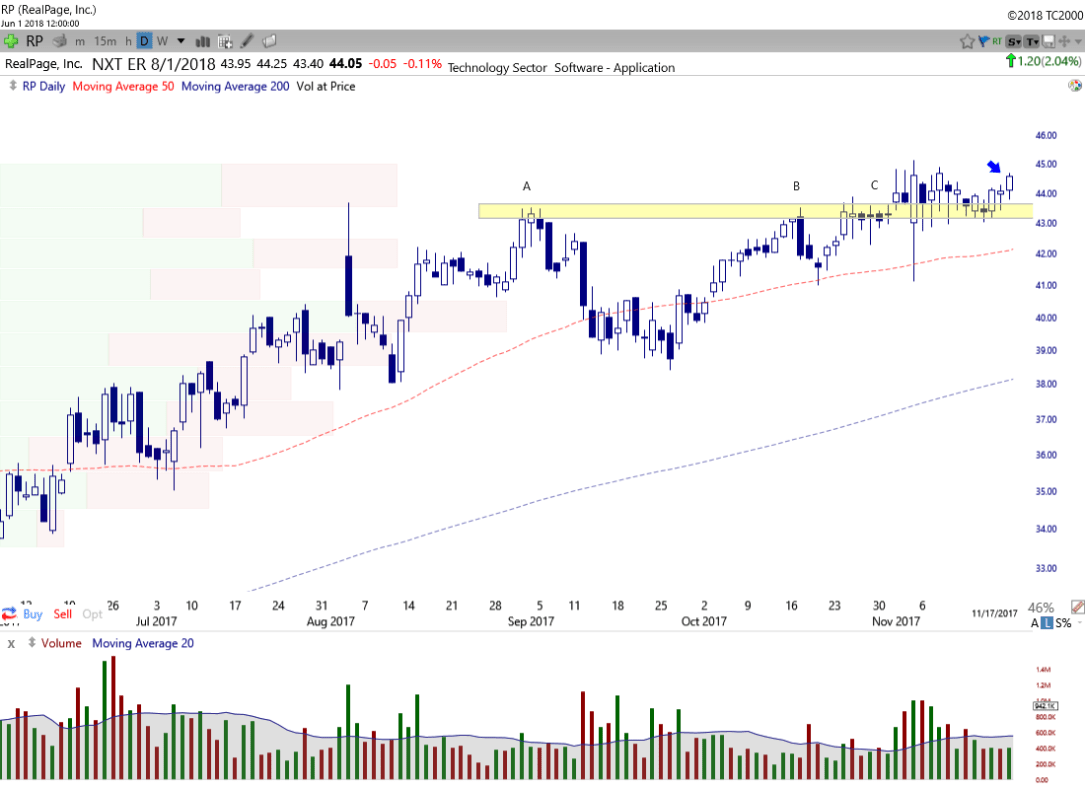
I’ve held RealPage, Inc. (RP) for about 5 months now and my initial entry was on 11/20/17. Clearly the stock is in an uptrend at this point and was sitting right below the all-time highs just made. The highlighted level just above 43 is what I was watching. Why? You can see this area act as resistance, or the ceiling, at the beginning of September (See A below). After a pullback from that area, it came back to retest in mid-October (See B) and was rejected again. Price respected this level so that tells me it’s important. It then had a smaller pullback before coming back to this level again at C. Often a smaller pullback than the previous pullback from a resistance area can indicate it may be ready for a breakout as demand started coming in sooner and at a higher price than the last time. Buyers want in. This is what is behind the right shoulder of an inverse head-and-shoulder pattern or the handle in a cup-and-handle pattern, which is what the chart below looks like. Chart patterns are great. I look for these as I scan through lots and lots of charts. I don’t think you need to get too hung up on the name or finding the perfect pattern you’d see in a textbook though. Basically, what is common in all patterns is that the stock had a level (horizontal support or trendline) that was acting one way (i.e. resistance) and it is not anymore suggesting a change in character. This change in character signals it is a good place to enter with the path of least resistance but just as important, if it goes the opposite way, you can get out with minimal damage as your risk is defined by a certain price level.
Back to the chart. Price broke above that key 43 area in early November but never really pulled away. After moving up a little, it kind of consolidated just above this level. Then after retesting it looked to me like it was ready to start a nice / tradable move as it started to pull away. As such, I entered on 11/20/17 at the blue arrow. Entry price 44.50. I liked the entry but at this point there were no guarantees it would go up. There are never any guarantees no matter how good the setup looks. As such, I’d look to set my stop level under the yellow highlighted area. I’m not one to strangle a position with a stop really close to the breakout area. At least not for a stock that it’s in a nice long-term uptrend like RP was at this point, so I’d give it a few percent below the breakout area. That’s just my preference for stocks in uptrends. Sometimes it helps keep you in a position that eventually becomes a nice winner or sometimes you give up a few extra percent before you get stopped off. Always tradeoffs. So at this point I’m in at 44.50 and have a stop a little above 42.
So I bought this one expecting a powerful move but didn’t really get that to start with. As you can see for to next month and a half or so it barely moved and just chopped around. The 43 level continued to hold so I was patient and decided to stick with it. It did have the benefit of being in a strong long term uptrend after all. Finally in early January it started to get going a bit and moved above the 46 area that acted as resistance the last two times it got there. Then on 1/11/18 (second blue arrow below) I sold HALF of my original position at 47.70 – 7.2% higher than the entry. Why’d I sell half? The stock was looking really good technically and starting to move up. However, it was up quite a bit over the last two weeks and perhaps it was time to consolidate / give some back. Perhaps not. I had no way of knowing here what was going to happen. What I did know is that this stock was in a nice long-term uptrend and just has a nice short-term move within the longer term trend. To take advantage of this short-term move I sold half to book the gains and planned to hold the other half with the trend. I’ve been doing this a long time and know myself enough to know that it would be hard for me to keep my full position on and plan to follow the trend knowing I might have to give up the gains I was sitting on right now. Selling half let’s me book the profits, reduce my position size, and most importantly allows me to mentally reset and be comfortable holding the remaining shares. See my short post on this strategy and reasons behind it here – Taking Gains.
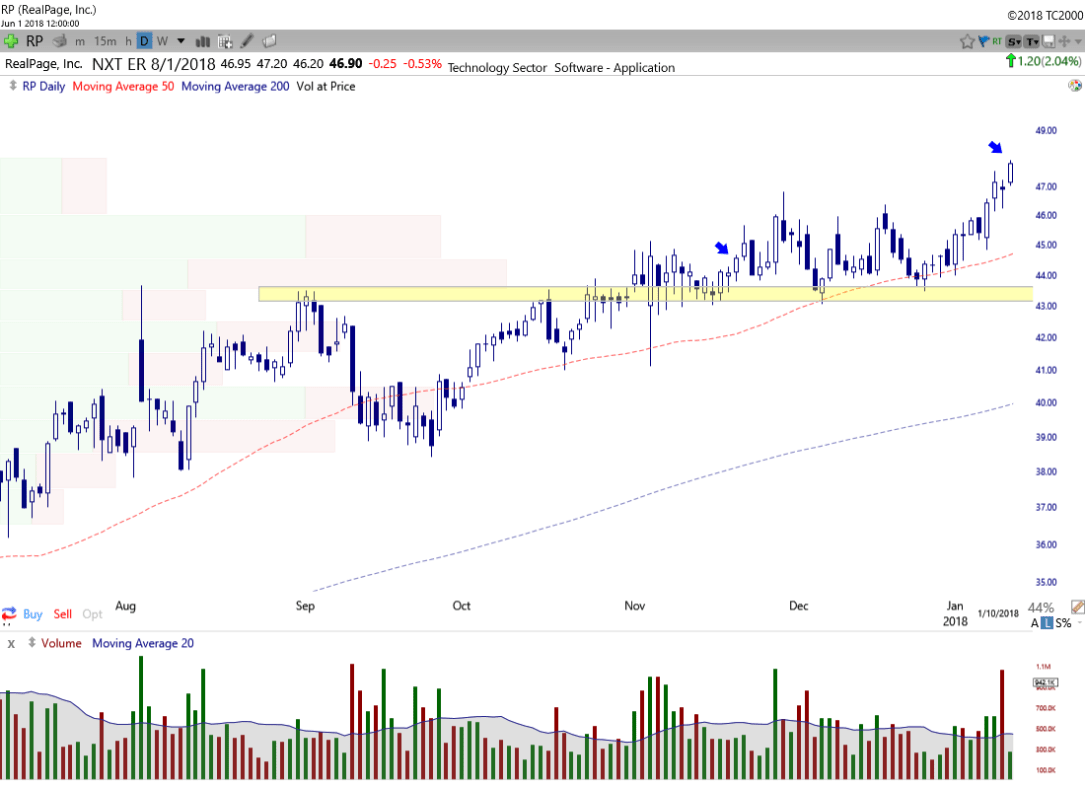
OK. So now I have some profits booked and my former full position in now about a half position (about 3.5% of my trading portfolio). Like I said above, now I’m in a better position to relax a bit and focus on the big picture. Micro managing a position in a strong uptrend that is acting well is a good recipe to sell winners way too early. Trust me. I’ve done this many many times over the years.
So from 1/11/18 till early May I just held this and observed. After my partial profits were taken, I watched the shares rise a bit before dipping under the level I sold some in early February. Price here dipped a little below that 46 level mentioned earlier which could have been an obvious place for a stop. This was also right around the 50 day moving average. Price dipped briefly below this level but closed above. Another reason I choose not to set stops to tight in stocks in uptrends. If the stock keeps making higher lows and highs I want to do my best to be in that trend and not get shaken out. It does happen though. It’s just part of it. You accept it and move on or even get back in if it sets up again. So until May 3rd (third blue arrow below) this gradually trended up (up about 23% from original entry). May 3rd is the date I mentioned here as earnings were due out and a decision had to be made – hold on through the announcement or sell here and book my profits. This is never an easy decision. Earnings releases can make for aggressive moves one way or the other and can make you feel foolish or like a genius in hindsight. Unfortunately, I do not possess the gift of hindsight in real time. Like I said, decisions like these are never easy and you are not going to make the “right” one every time. That’s why it’s so important to make the decision you feel is best and move on regardless of the outcome. Don’t dwell. So what did I do here? I held. Why? Two reasons. For one, I had a nice “cushion” or unrealized gains on these shares and the stock was working well / trending up. The second is that I had already sold half and booked profits so my position sizing (which is so important) made me more comfortable holding here knowing that if the market was disappointed in the results and shares traded down after the release, the hit would not have a significant impact on my overall portfolio. So having a nice gain and smaller position size were key to my decision to hold through earnings. If you want to capture big long term gains, which is the goal with the trending portion of my holdings, you need to hold through earnings announcements. They do come every quarter after all.
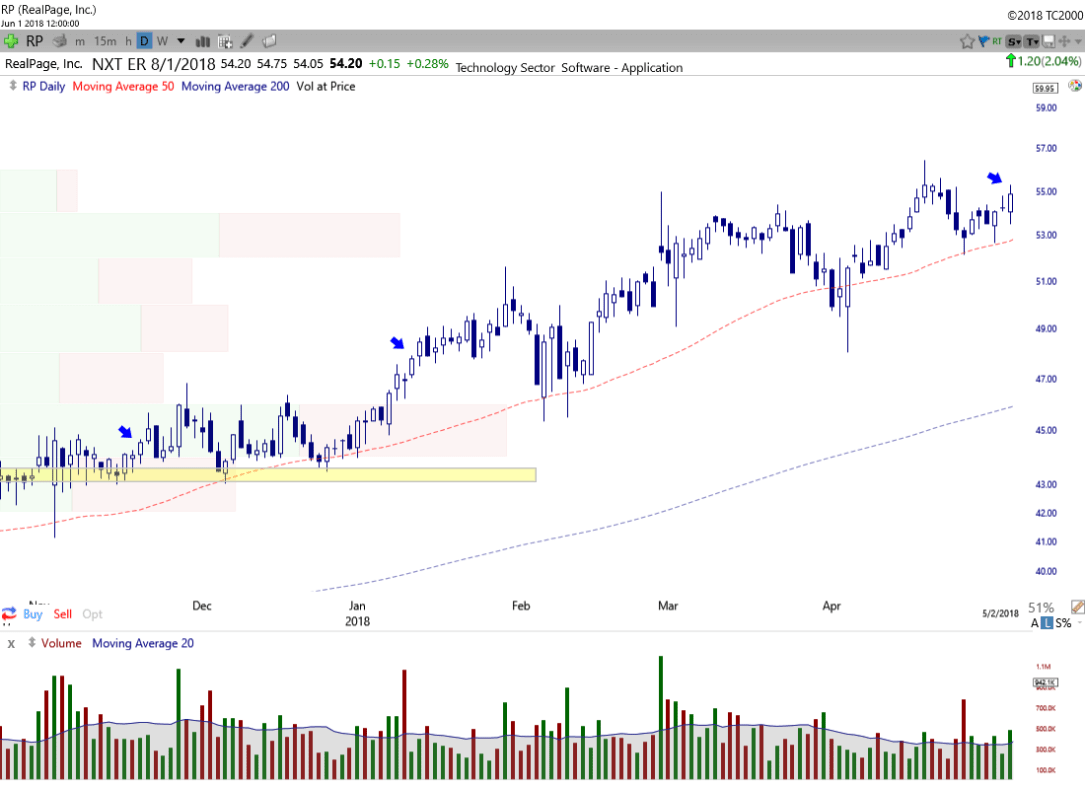
Fortunately, the earnings announced May 3rd were received positively by the market and shares immediately gapped up gaining over 7%. Very nice! No reason to get over confident though as I’ve had plenty and will continue to have plenty go the other way. It’s key to remember with earnings releases, the actual numbers aren’t the important part. It’s the reaction from the market that is important. Fortunately here the reaction was positive and after that gap up shares moved up a couple more days before some healthy consolidation of the gains over the next few weeks. At this point, with my shares in trend following mode and my position size reduced, my stop is well under the current price and even the earnings gap area. So that brings me to last Friday. After this healthy consolidation of gains price looked to be perking up again. So I added to my existing shares. I liked how the chart looked so I entered. I would have done the same regardless of any existing position. I did however, enter a half position here on the move up above the consolidation down trend line and the 59.50ish horizontal level. The stop on this portion is around 58.00 just below the consolidation lows and tighter than my stop for the trending shares which are up about 35% from my initial entry.

Who knows how this trade will continue to work. It’s out of my hands. The only things I can control are the decisions to enter, hold, and exit. If capturing bigger / longer term gains is something that you strive to do, it’s important to let your trades work and be a little hands off. This can be difficult at times (I know it is for me) and goes against the way our brains are wired. Hopefully, this post helped explain how I’ve been able to do this, so far at least, for this trade.
Please note, this describes my process for a trade that is working. Trust me – they don’t all work. In fact, I plan on them not working. That is why the first thing I look at when scanning charts for potential positions is where my stop area would be. Risk management is priority number one. If you get stopped out no big deal. There’s always plenty of opportunities out there and you want to be sure you have capital left to take advantage of them.
