
All,
It was a crazy ending to last week for sure. A lot of emotion. I was watching a lot of bullish looking setups coming into the week and most of those charts now look like no touches to me. A good reminder of how things can change quick and the importance of managing risk. As so many have pointed out, the S&P closed right around it’s upward sloping 200 day moving average Friday. This has the potential to act as support as it did in early February. It’s very possible we get a bit of a relief rally after that aggressive selling to end last week. Anything’s possible. I’m not extremely confident that we touch those highs made in January anytime soon though. I’m definitely open to that scenario but I just wouldn’t count on it at this point.
This weekend I scanned though every chart in the S&P 500. No moving averages. HLC bar charts. Just price and volume. No other indicators. This uncluttered view is how I typically scan for patterns, trendlines, etc. It’s just easier for my eye to catch them with this view. My standard view for trading are daily candles with a 50 and 200 day MA or weekly candles with a 40 week (200 day) MA and a momentum (MACD) indicator. I use some other indicators from time to time as well but it’s this plain HLC bar view I prefer when scanning through a large number of charts. The feeling I got after looking through all these charts is there was a lot of damage done last week. There were very few charts I saw that looked like buys in my opinion and a lot that looked like the opposite. Price was ripping below areas that looked like potential support areas on a lot of charts and a lot look they may be in the beginning stages of new downtrends. Like I said, things can change quick. There are still a lot of positives out there and I think it’s a little early to call an end to this bull market from a longer-term perspective but I didn’t see much in this index suggesting all is well and good. Maybe some chop in a trading range is what we end up getting. That would be frustrating for bulls and bears but is another possibility to consider.
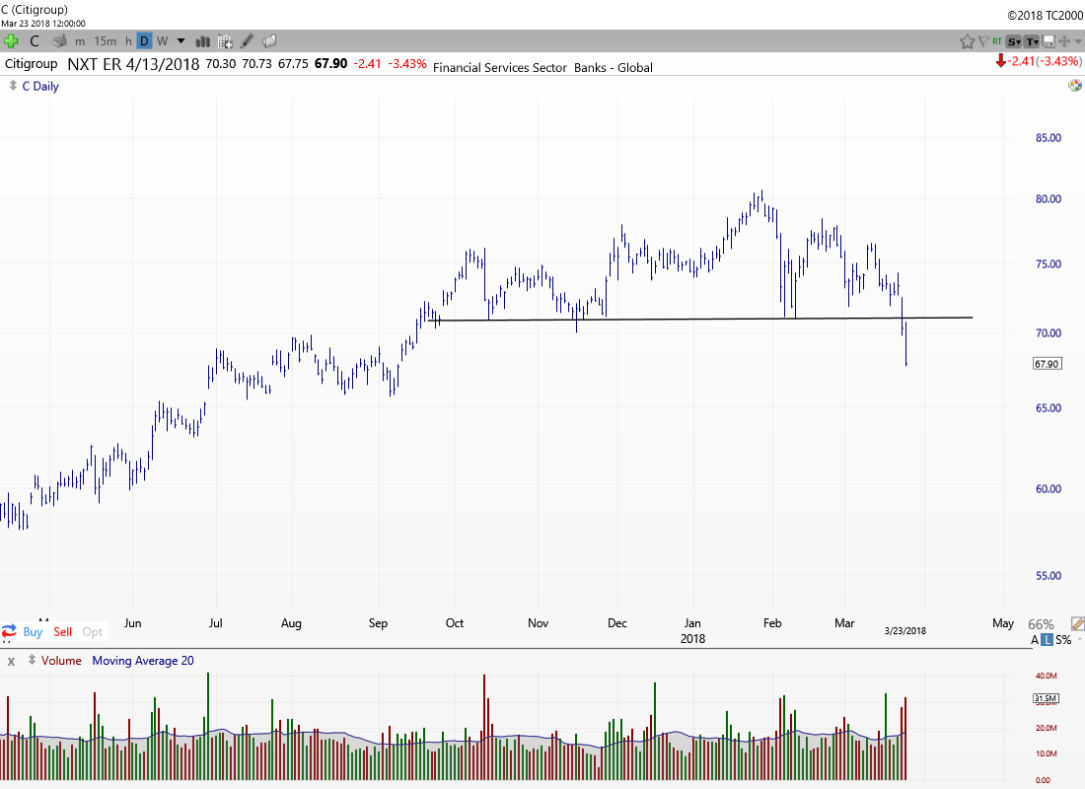
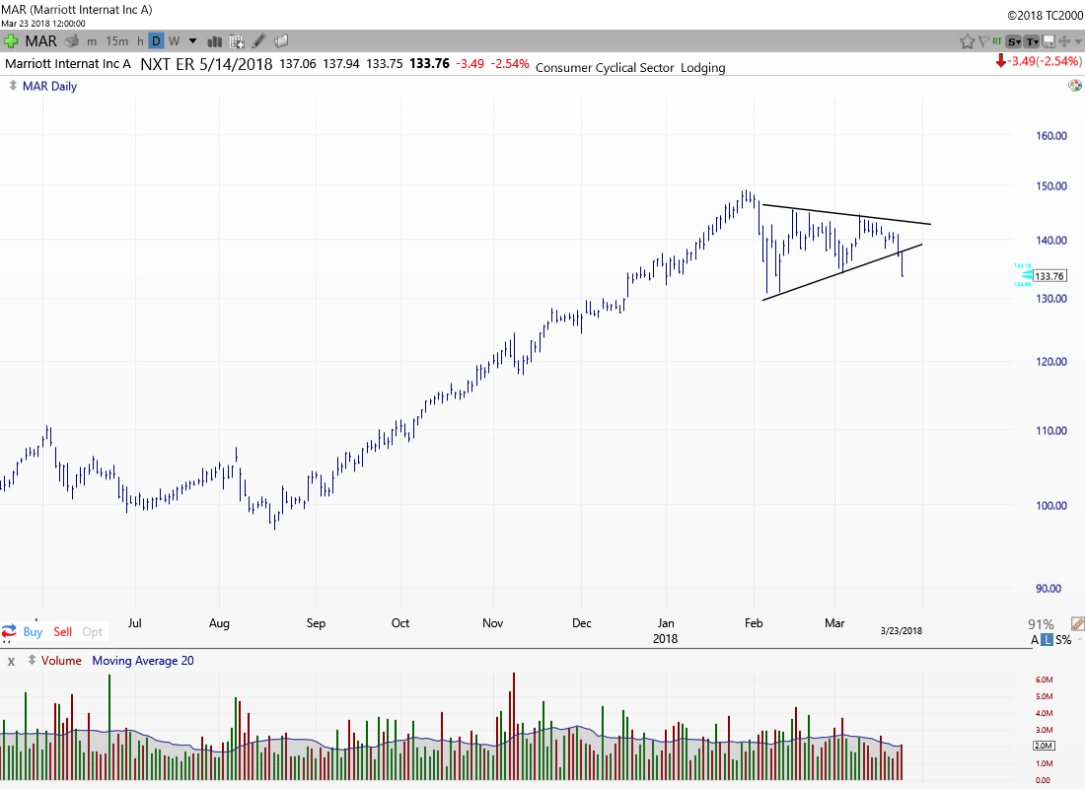
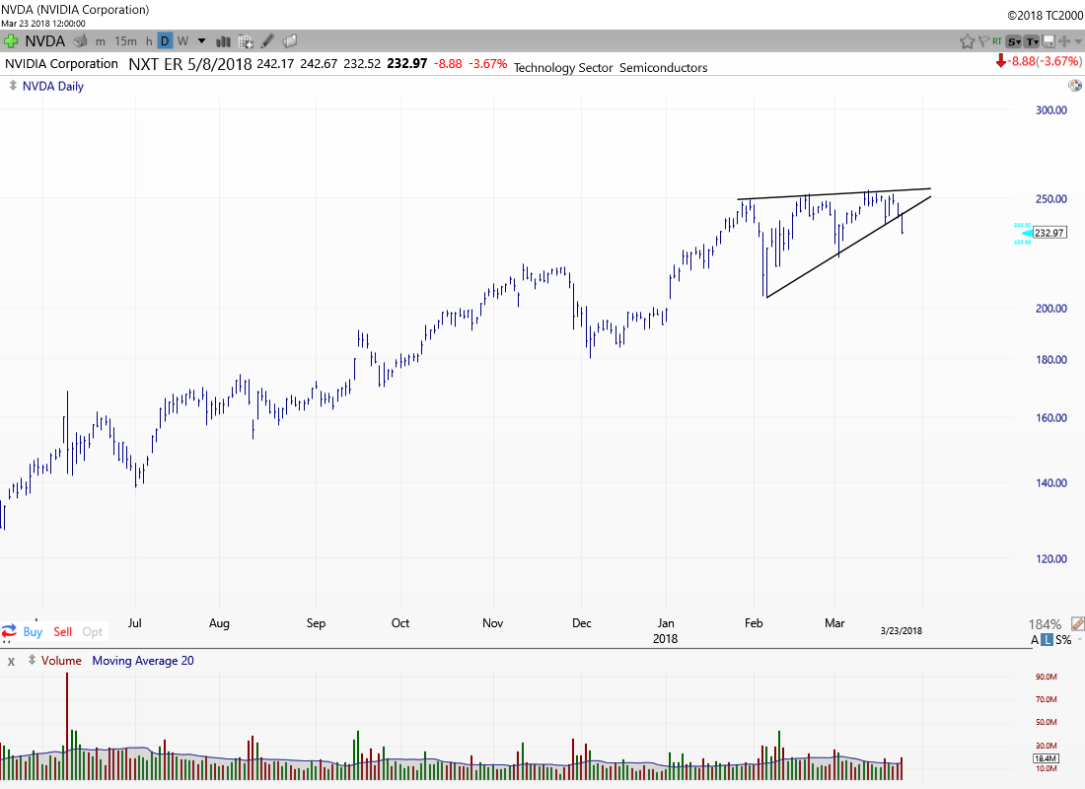
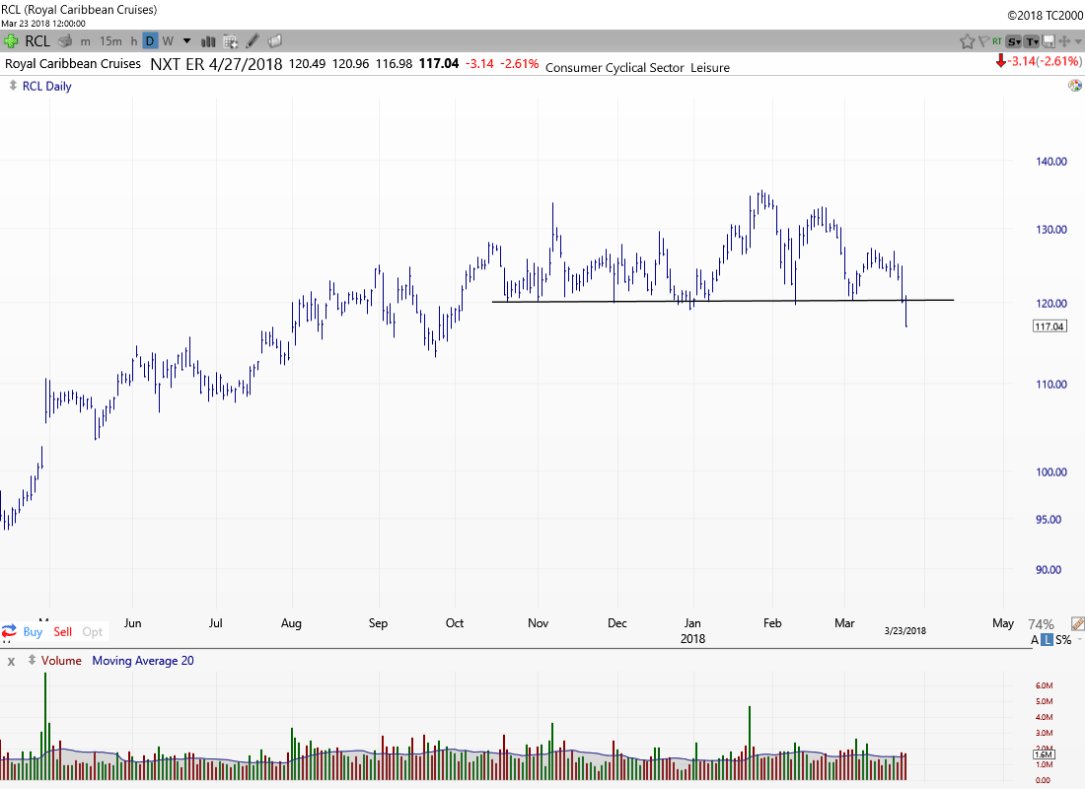
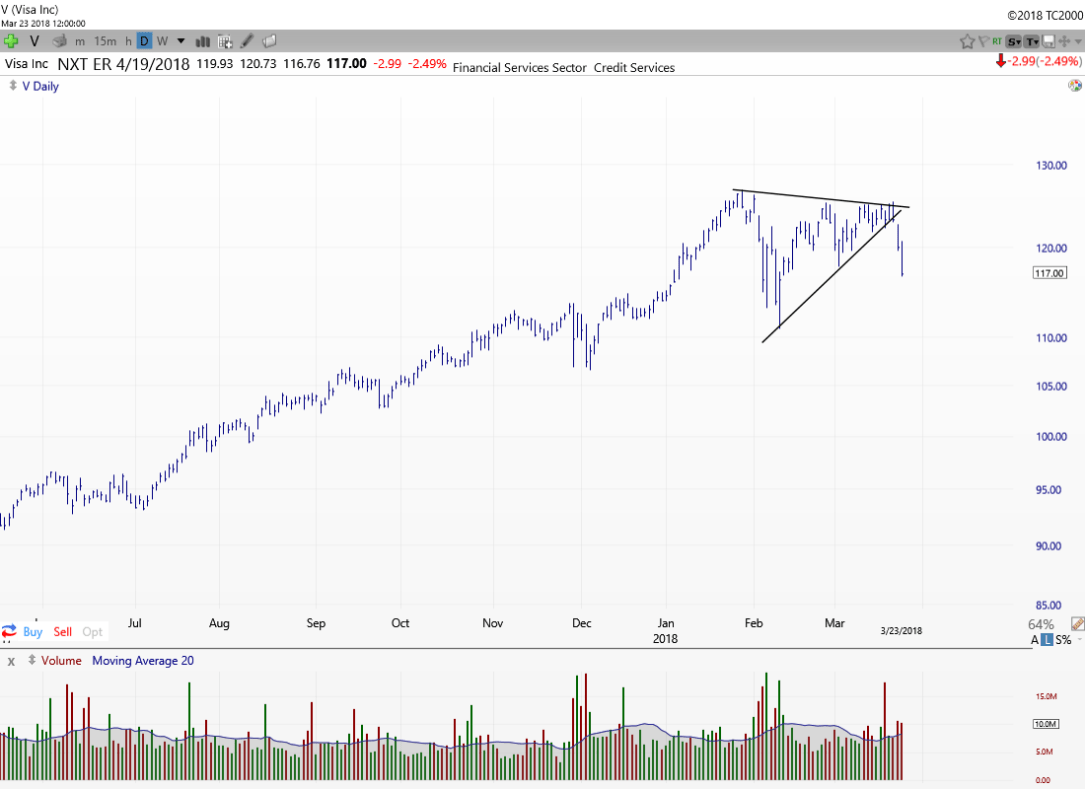
Here’s a few charts I wanted to point out that look bearish, broke key areas, and may be short candidates.

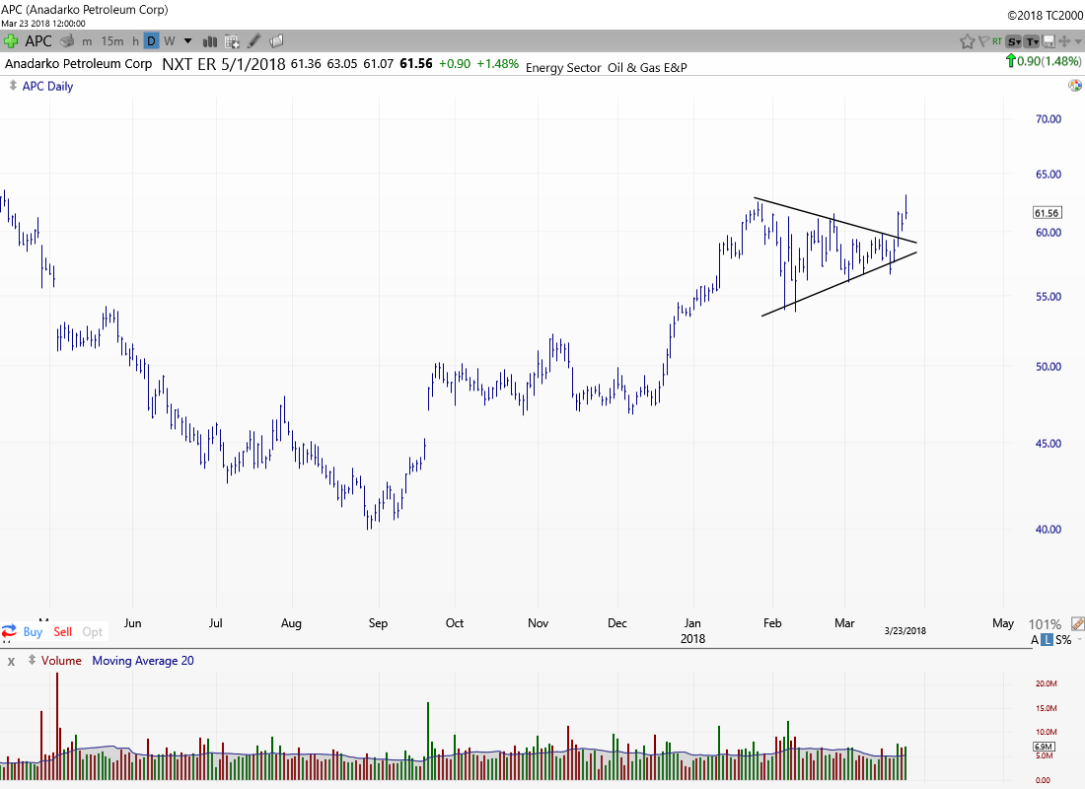
Some energy names look to be setting up nicely. Here’s APC breaking out of some consolidation and following through.
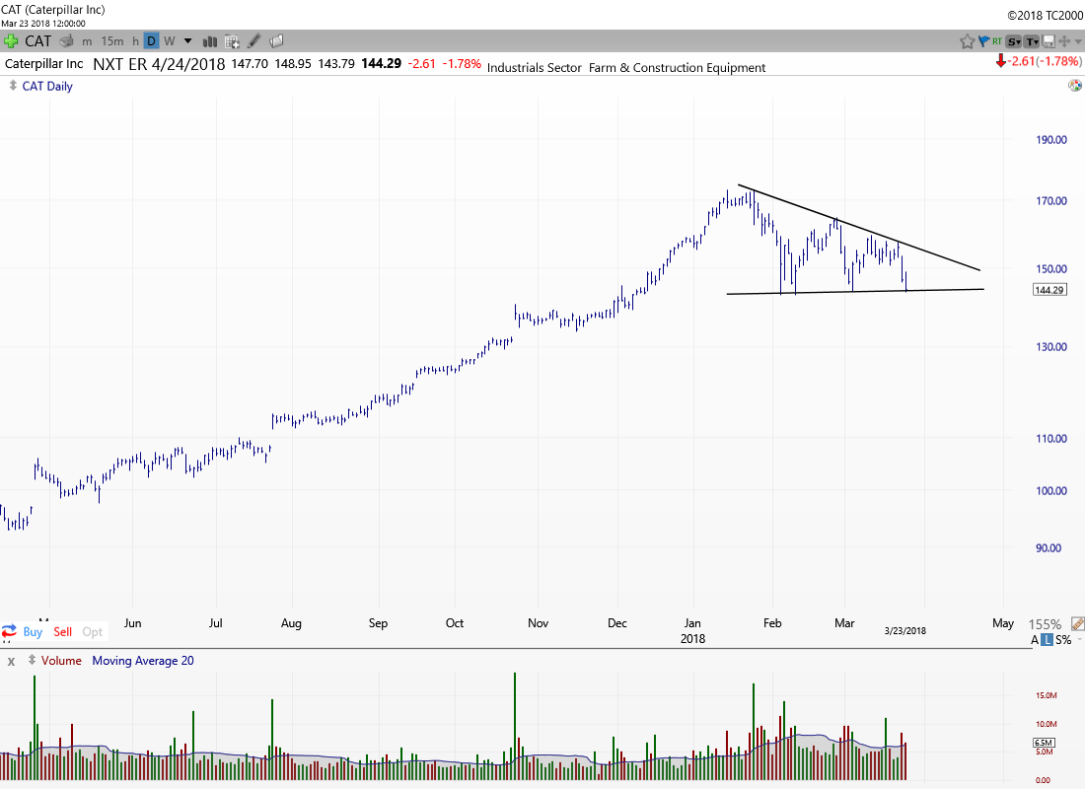
If you follow me on Twitter, I’m sure you’ve seen me express some concern over the biggest Dow component Boeing lately. CAT is another one I’m watching. Still trading within the pattern for now so just waiting and watching for a break.
Should be an exciting week. Still leaning long in my portfolio so will welcome a bounce but have to be prepared if things move the other way as well. Thank you and have a great week.
If you are interested in educational content, trade reviews, and live trade alerts from both myself and CJ Agresta (@TTPTrading on Twitter) please check out our site at TTP Trading. Monthly memberships include access to both of us for $69/month. Feel free to reach out with any questions.
