
Gold and a lot of gold miners have had a big run over the last month or so. For me it’s still to early to tell if this is the start of something bigger but the potential is there for sure. There are a lot of miners presenting nice risk / reward opportunities right now on the long side in my opinion. Let’s take a look at some of these names in addition to looking at the big picture.
First the big picture. Here’s a 20 year chart of gold. As you are likely aware, gold had an amazing 2001 to 2011. It then gave back about 50% of those gains of the next 5 years and is up about 30% since that 2016 low. Here’s the chart:
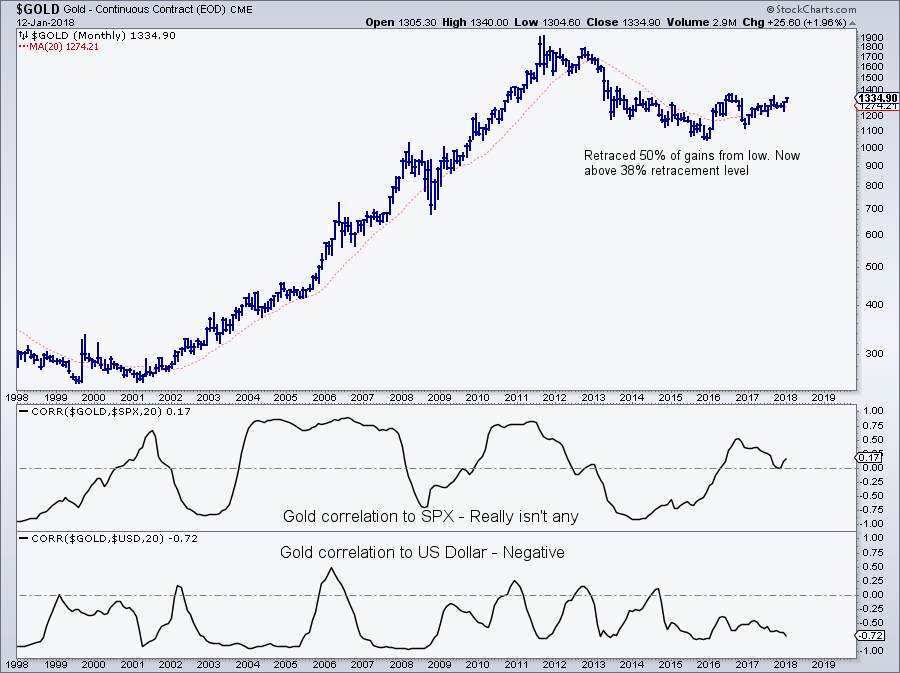
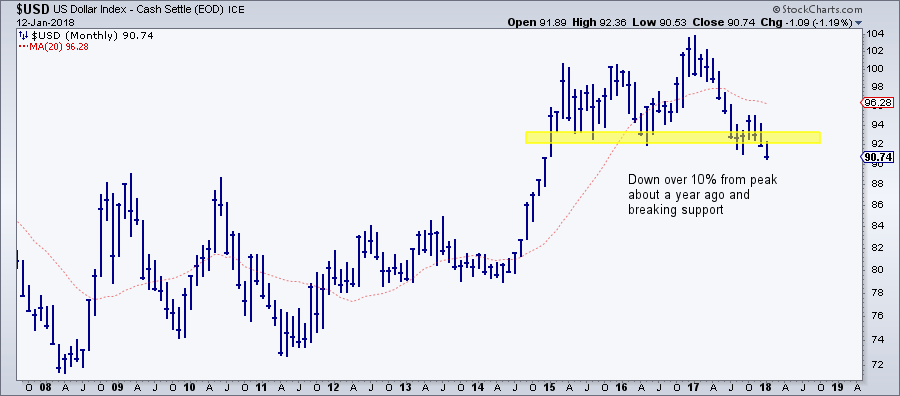
At a glance, this has potential to continue moving up in my opinion. Note that gold has not really been strongly correlated to stocks which makes it interesting from a portfolio management perspective. It is also negatively correlated to the US dollar as shown at the bottom. This is likely part of the reason gold has done well lately as the US dollar has been tanking. See below:
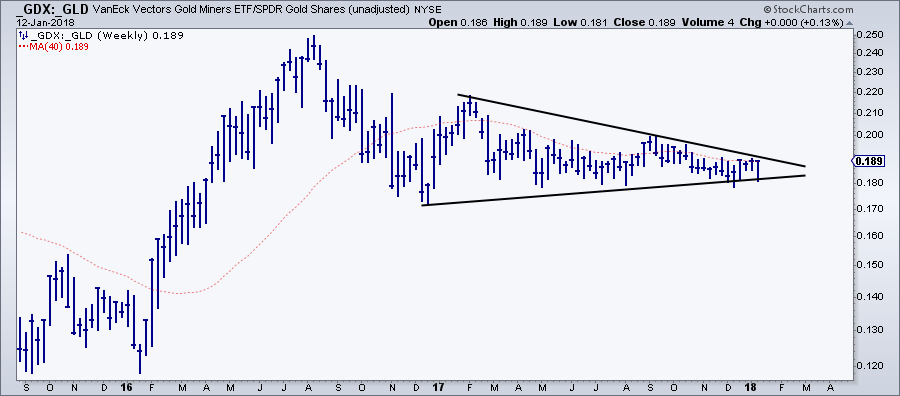
Lastly, check out the ratio of gold miners to gold. I used the ETFs GDX and GLD to represent these. This ratio has been tightening for over a year and looks ready to break. It’s considered by many to be bullish for gold and miners if miners are outperforming the metal as they typically move more aggressively. Here’s the comparative chart:
So this helps setup the environment a bit. There’s also the gold vs. silver ratio (which isn’t confirming anything yet in my view) and countless others but this provides a good starting point.
Analysis like this is helpful to establish the big picture but in the end, I would only trade securities based on their own characteristics. Each chart is traded based on it’s own merit, regardless of what it “should” be doing based on some intermarket analysis. That being said, let’s look at some gold miner charts (and one silver miner) that are currently presenting nice setups in my opinion. All of these are weekly charts to look at a longer term / bigger picture view. As usual, I’ve highlighted key price points. For long opportunities, I’d only want to be long above these levels. Here we go:
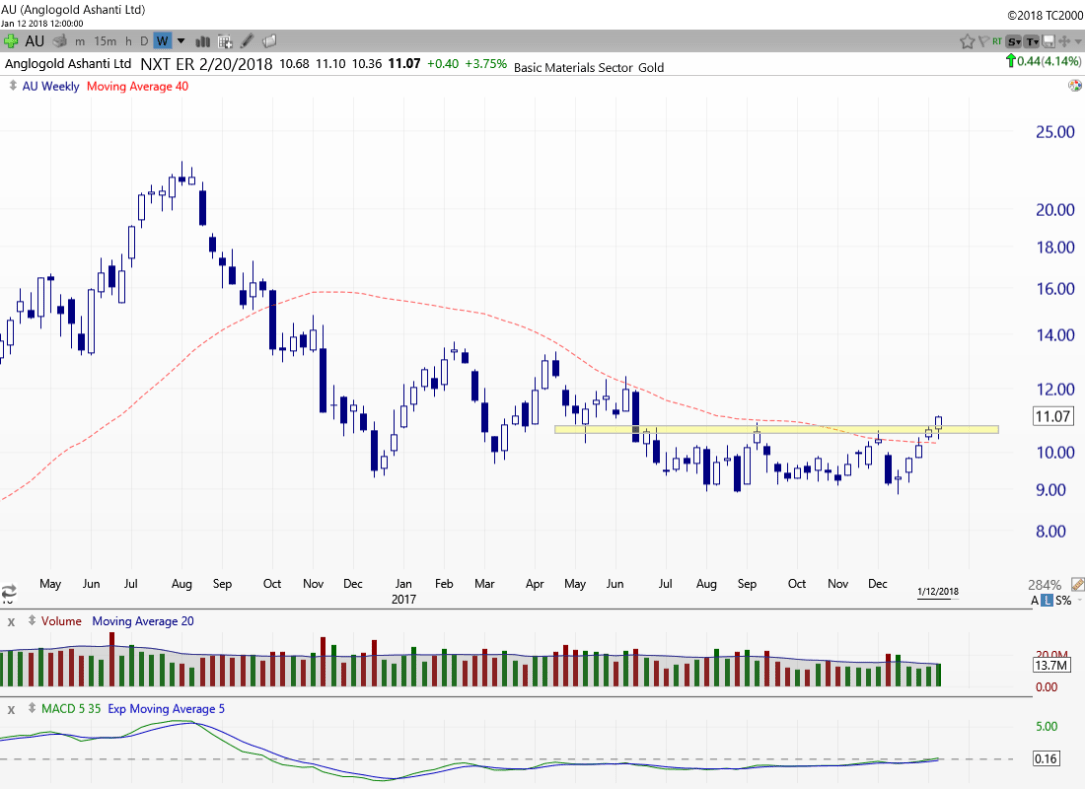
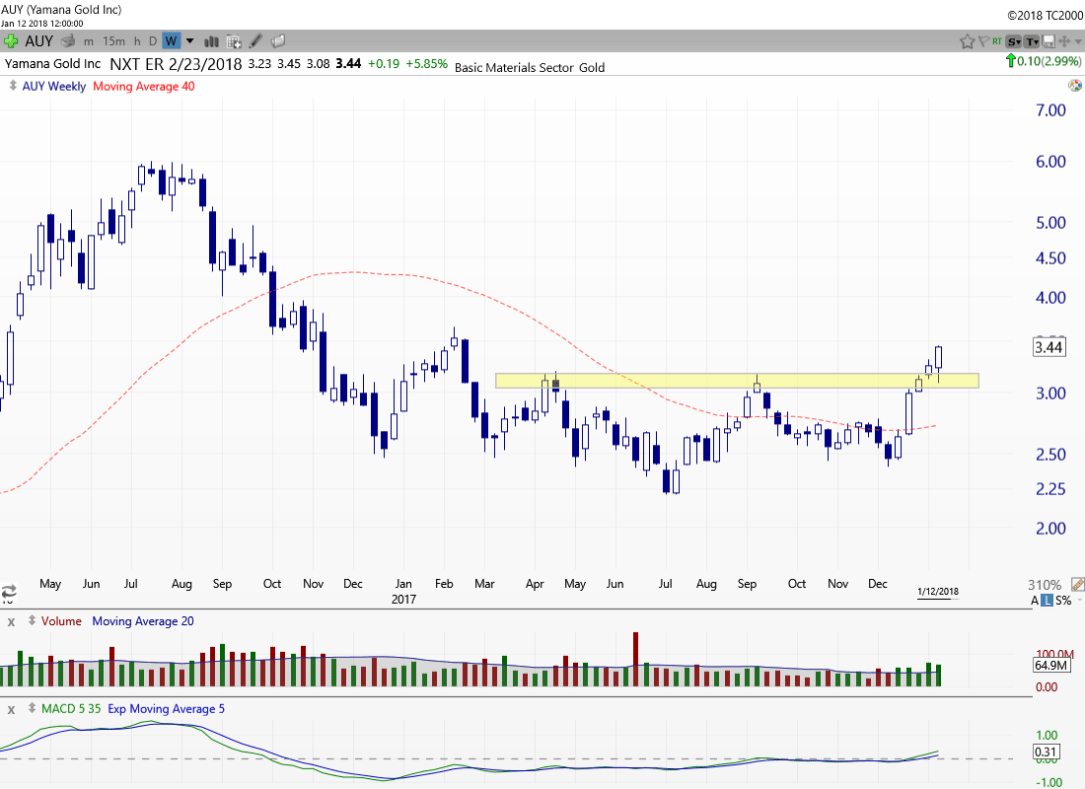
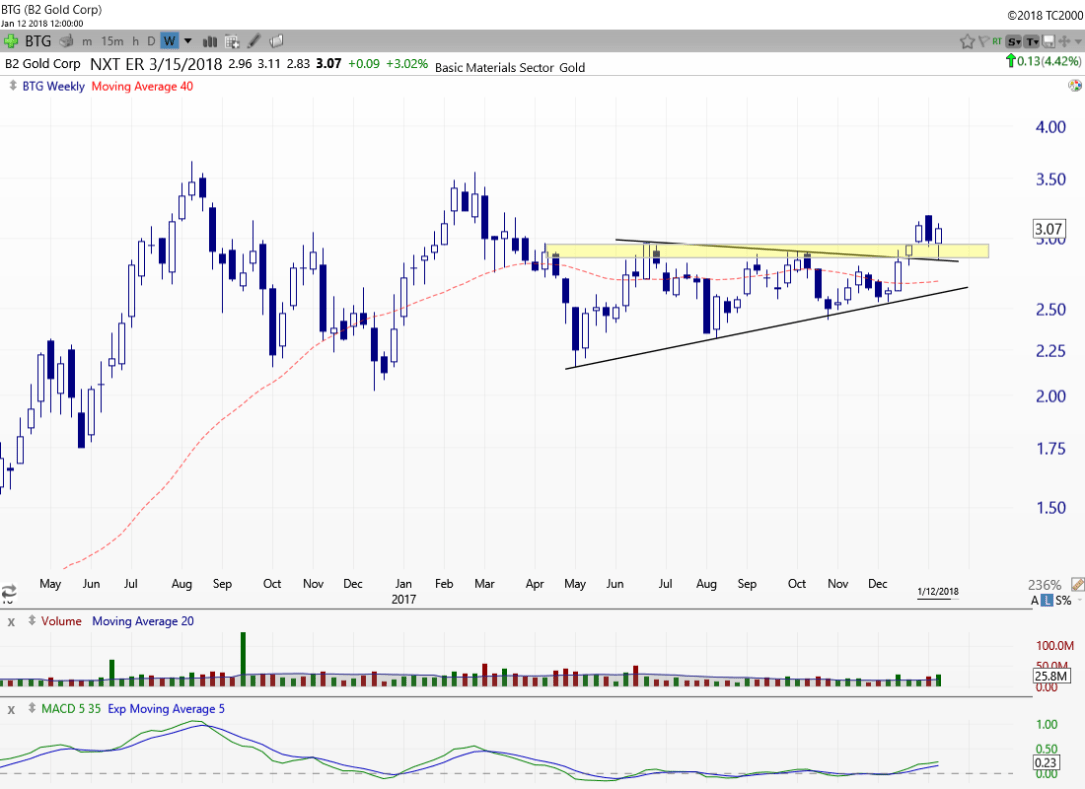
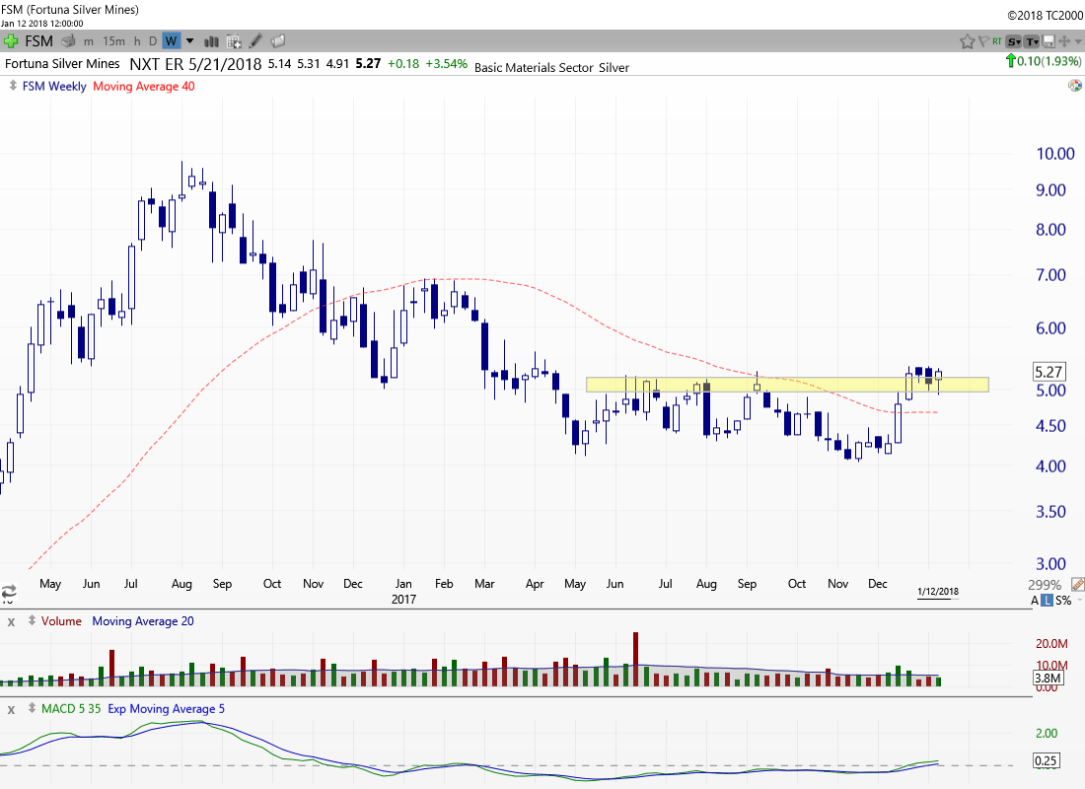
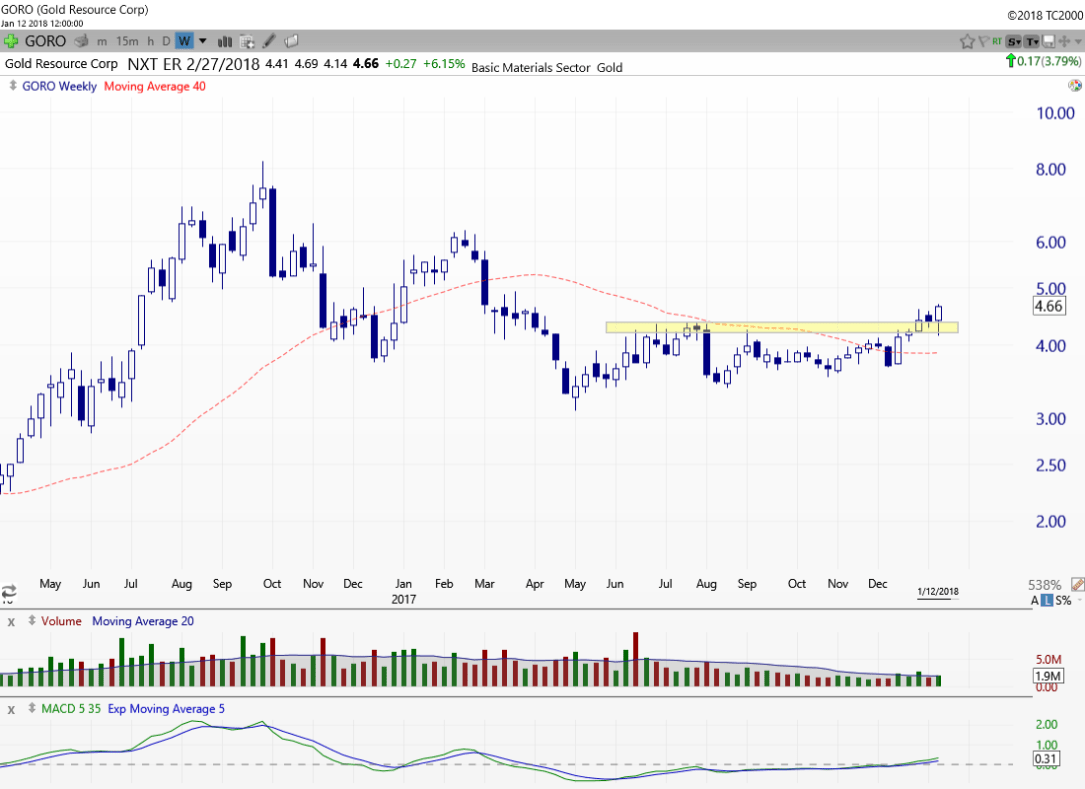
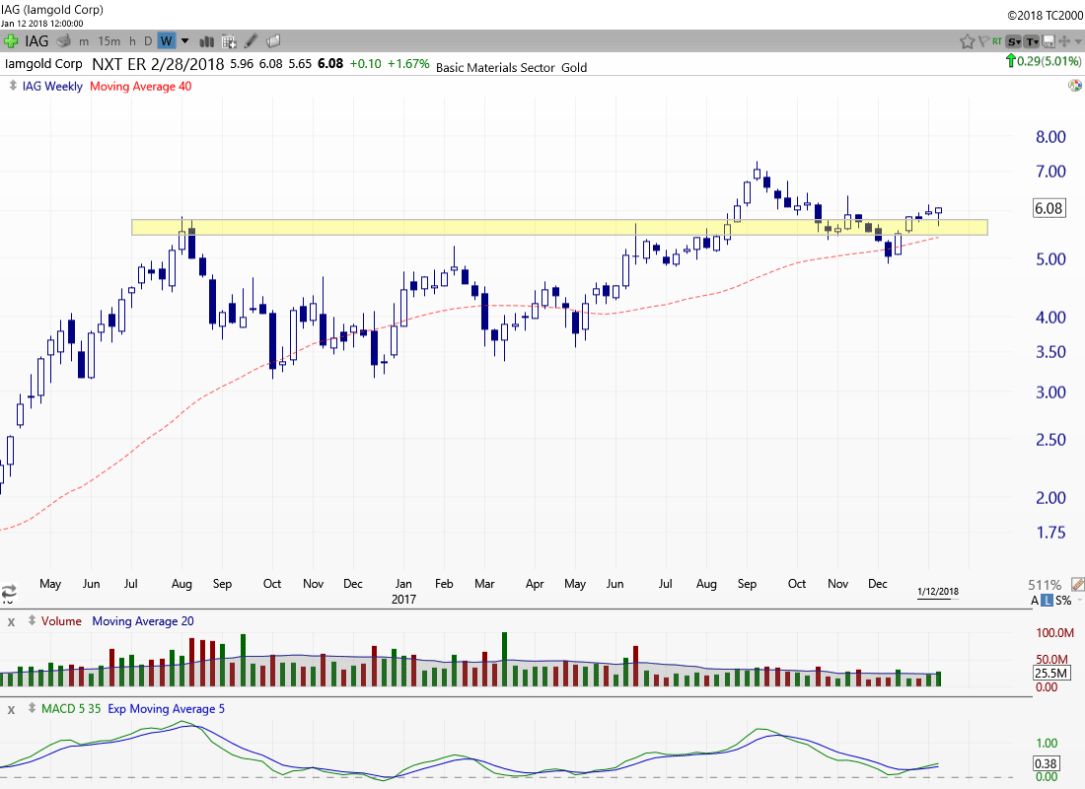
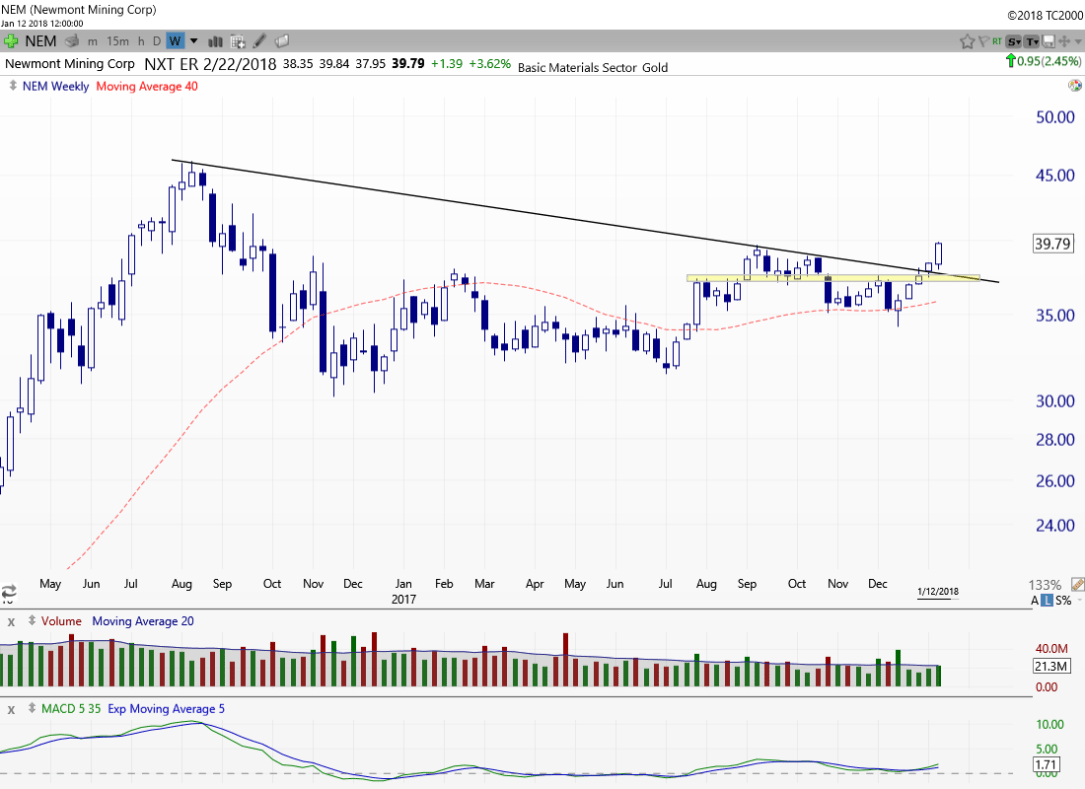
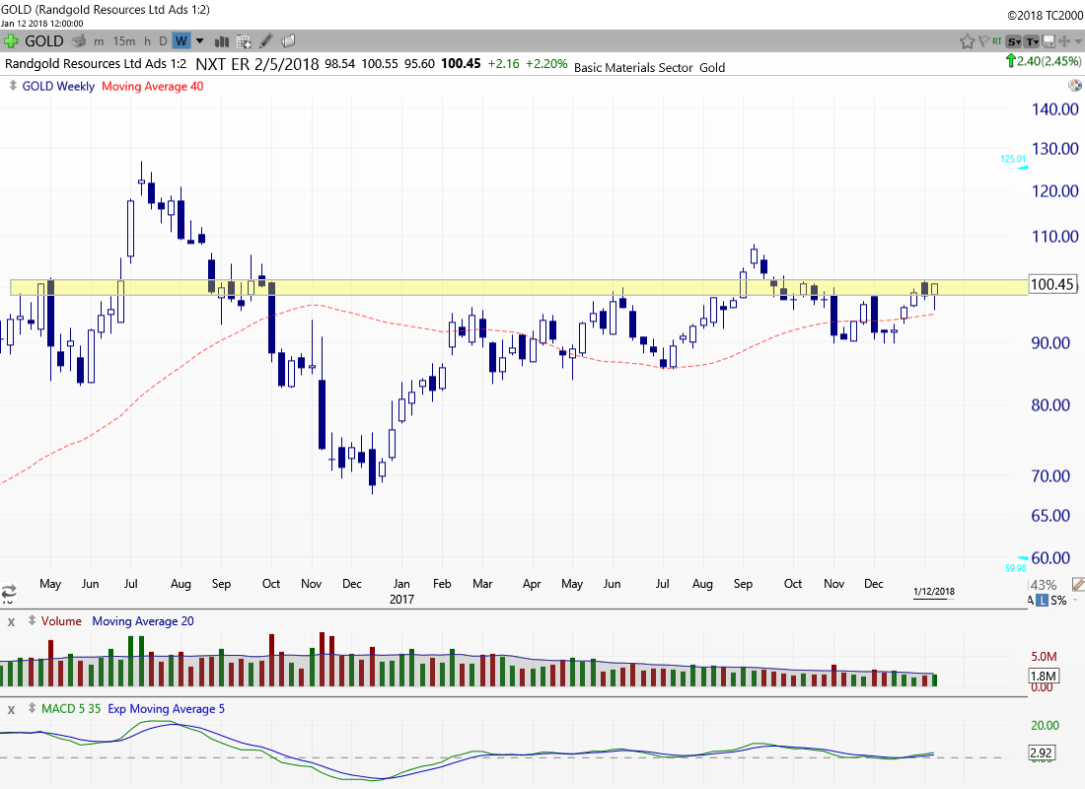
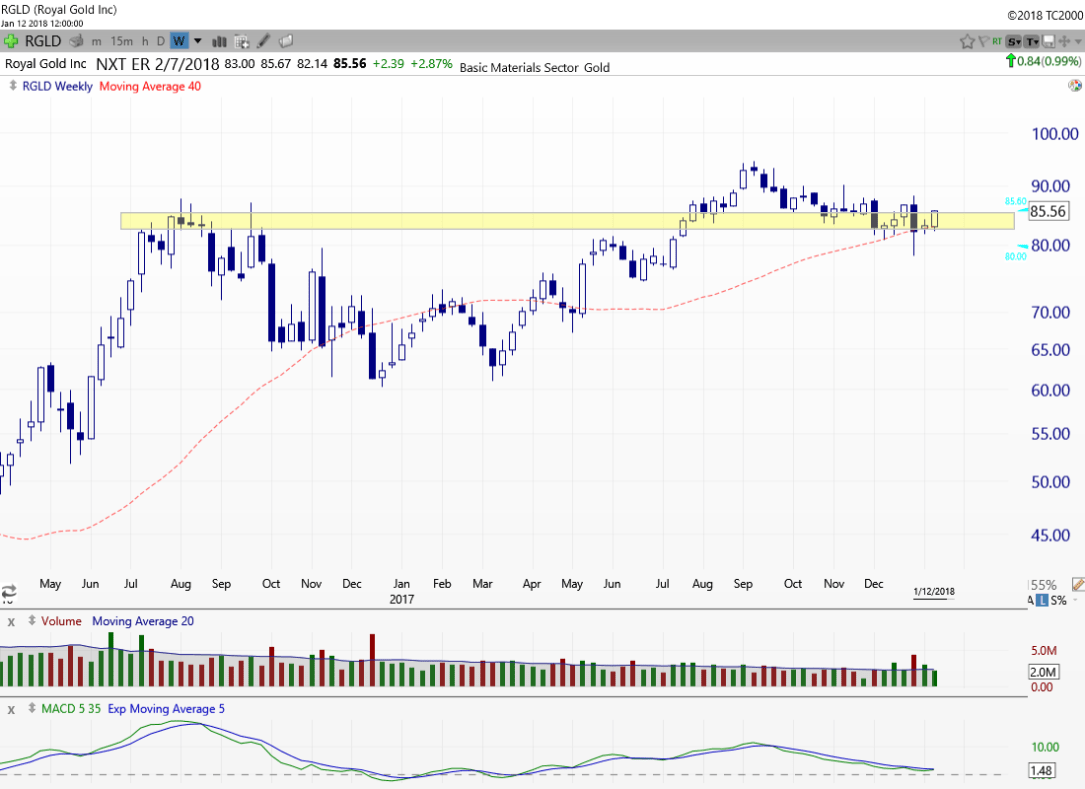
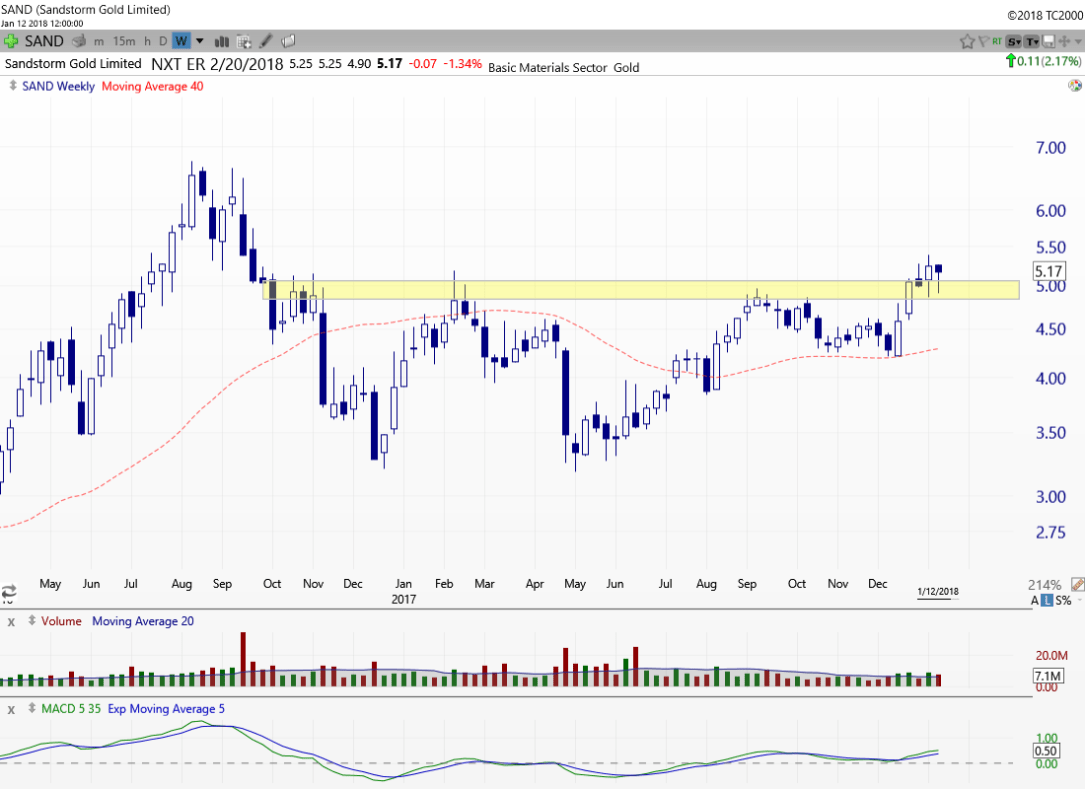
Some beauties here. All these charts show prices just above or very near key price levels. These price levels were resistance so “should” act as support going forward. Of course in the markets anything is possible and you have to be prepared. That’s why I said “should”. Nothing is guaranteed. Risk management / exiting positions when your reason for buying is no longer valid is priority #1.
Also, all charts shown are above their 40 week (200 day) moving average. This is a metric used by many and indicates these are in or are entering a longer-term uptrend. The MACD momentum indicator also shows many of these with momentum just starting to turn up. To me, any indicators (even volume) are FAR less important than all that really matters – price action. I’d say price action looks promising on this group.
If you are interested in in-depth sector analysis, educational materials, and of course live trade alerts please check out TTP Trading. For only $69/month (cancel anytime) you get all of this from both me and veteran trader CJ Argesta (@TTPtrading on Twitter). Members are off to a great start so far and we’ve been able to enjoy some nice gains and we’d love to have you join us. Please reach out if you have questions or would like to see our history of recommended trades.
I hope you all enjoy the rest of your weekend. Take care!

2 thoughts on “Golden Opportunities in 2018”