
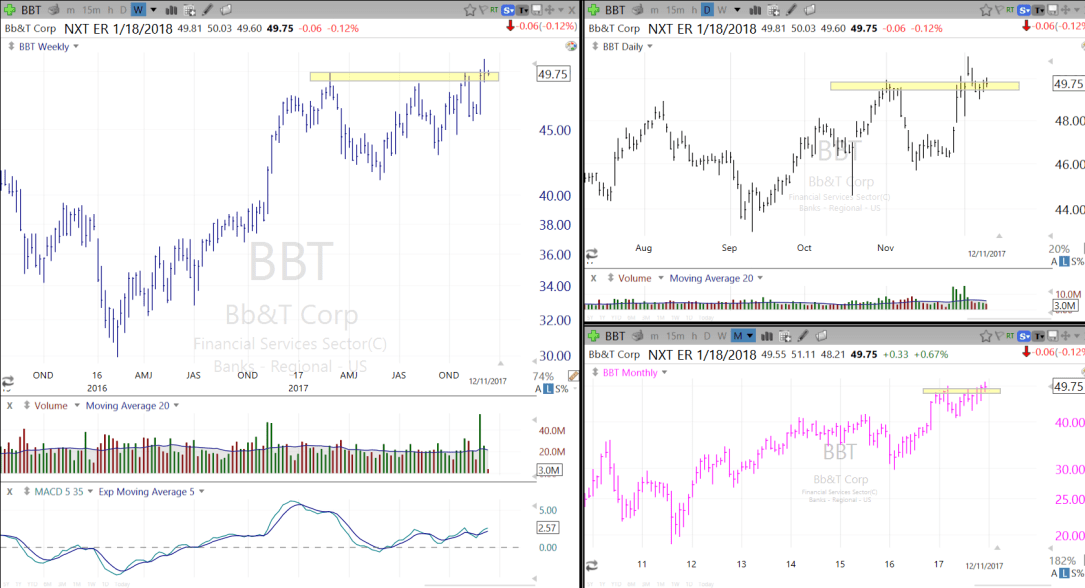
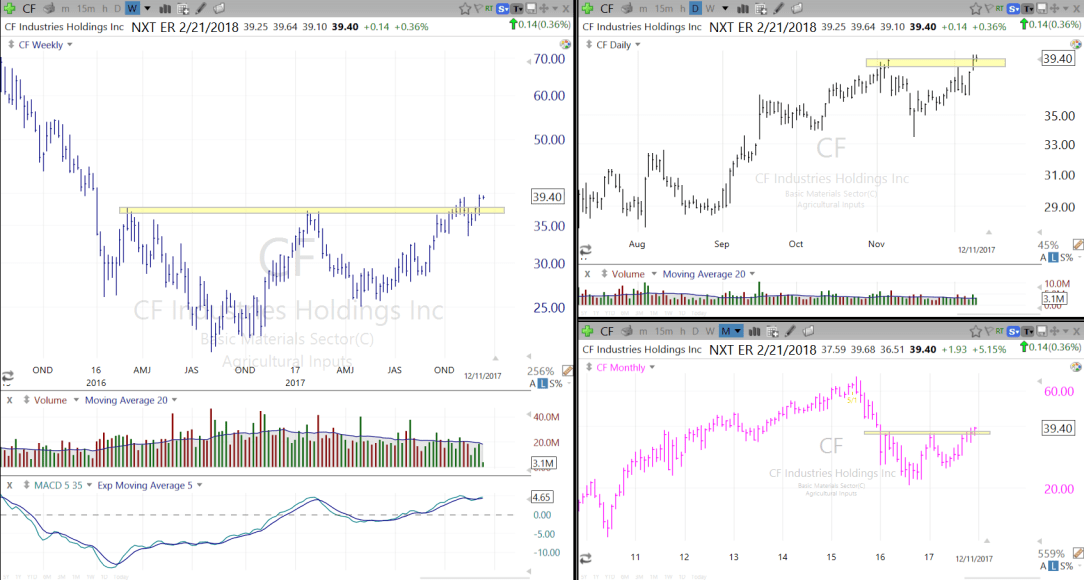
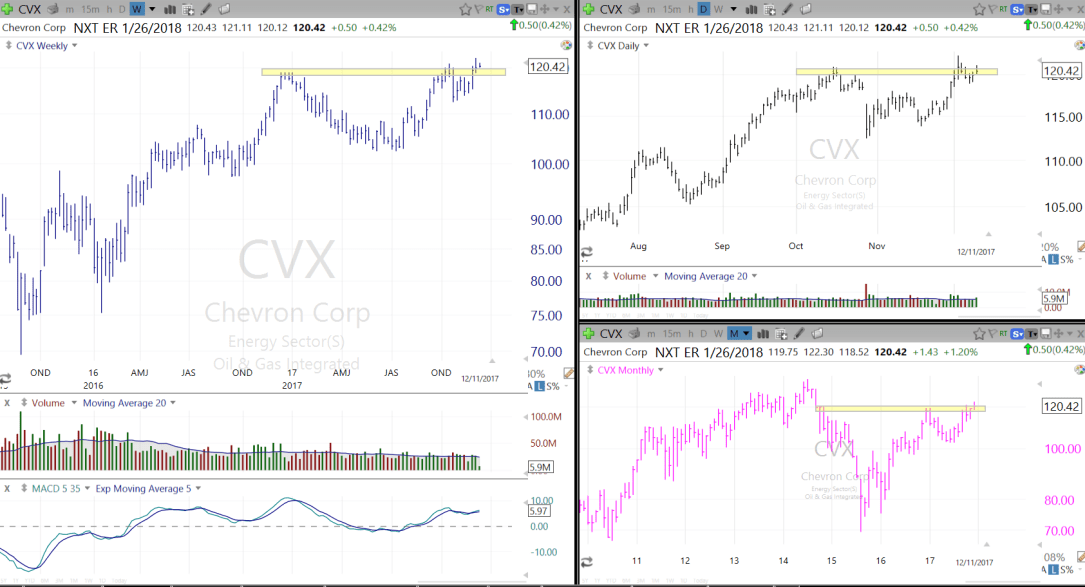
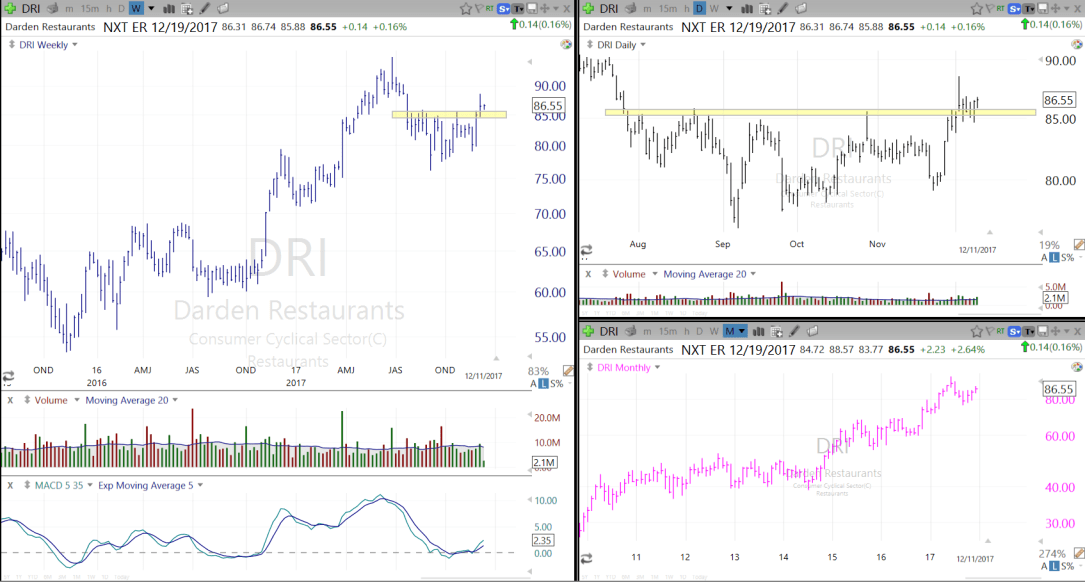
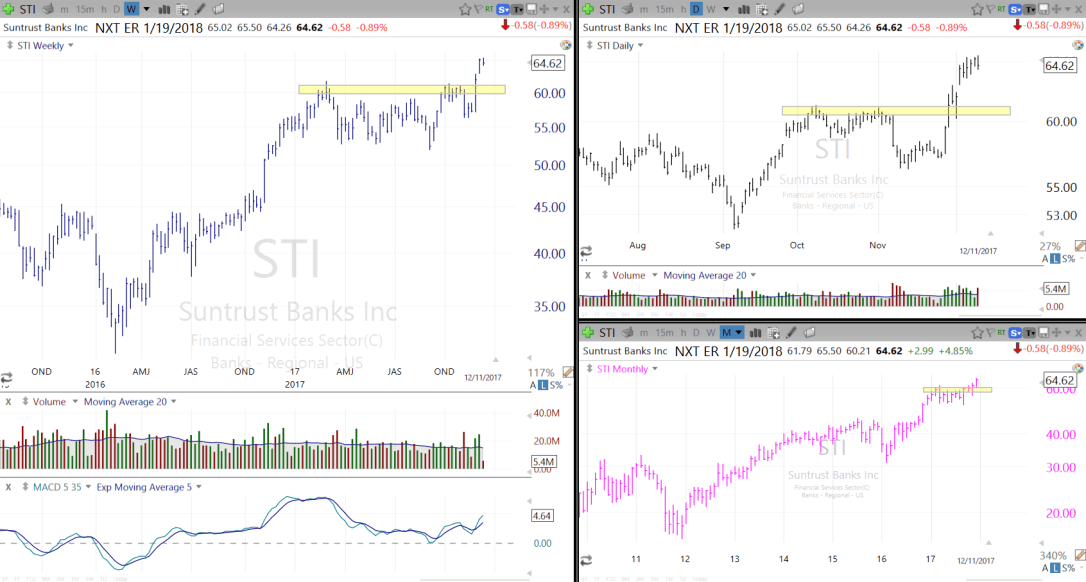
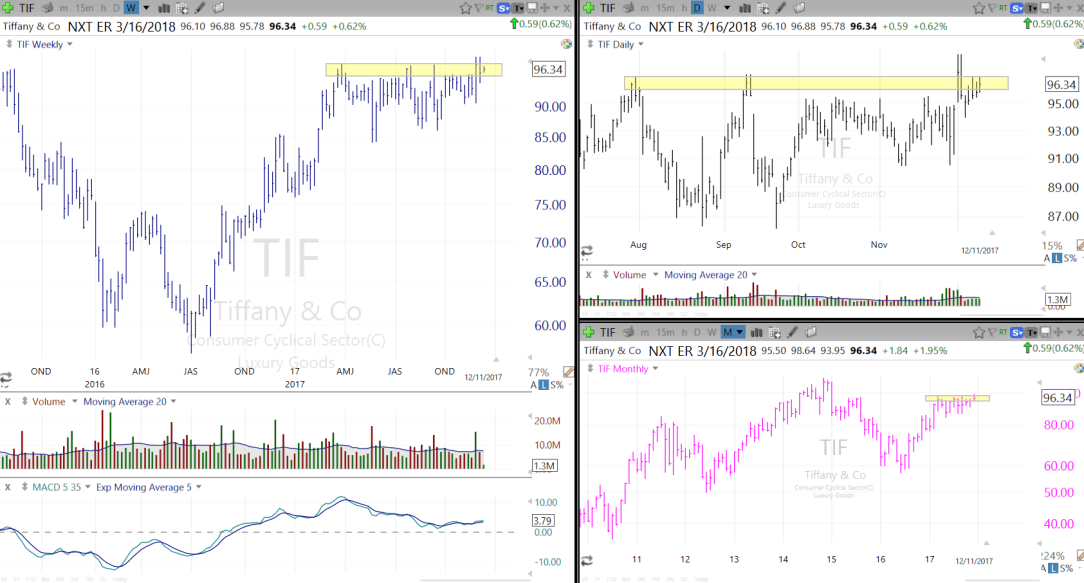
Reviewing multiple timeframes is a key part of my process. I’ve mentioned this many times before. You want these time frames to align when entering a trade or at a minimum not provide conflicting information. My default view is a weekly chart going back a few years and my trade timing is based on daily charts. I recently switched to TC 2000 for my charting software which has really helped me speed up my chart reviews. I also love the option to quickly click through charts and look at multiple time frames all at once.
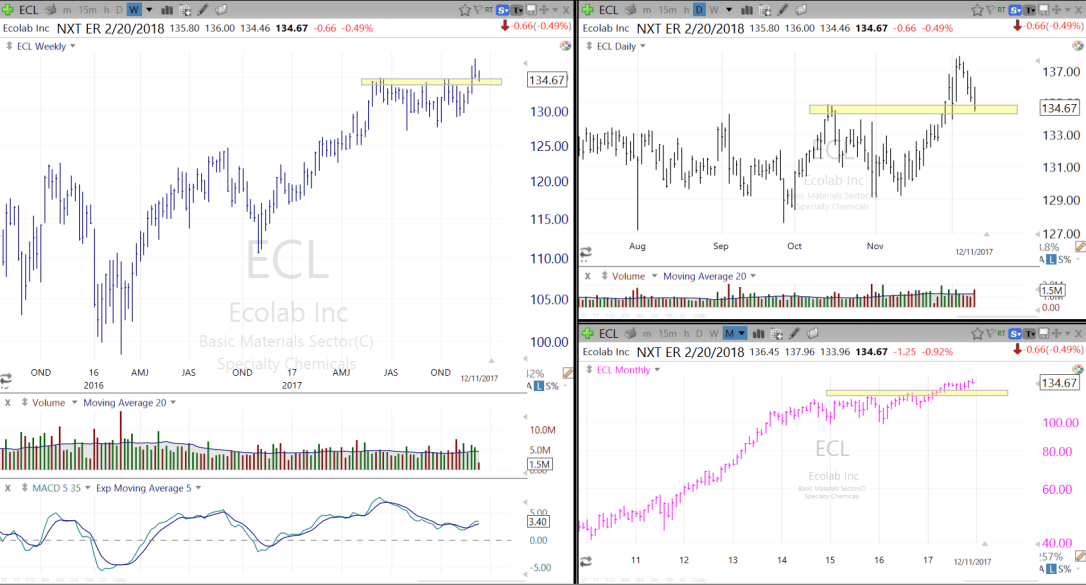
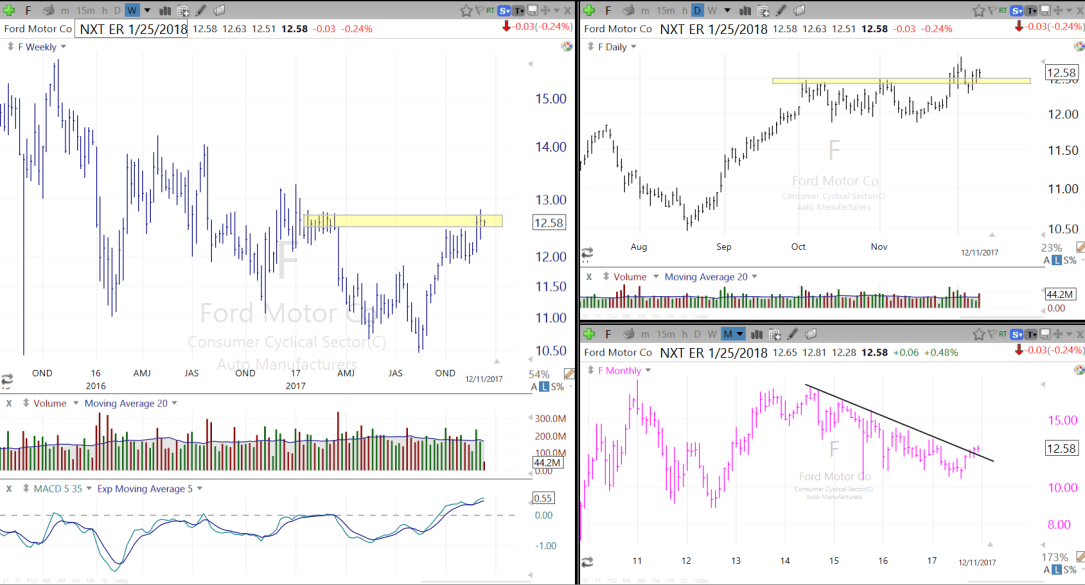
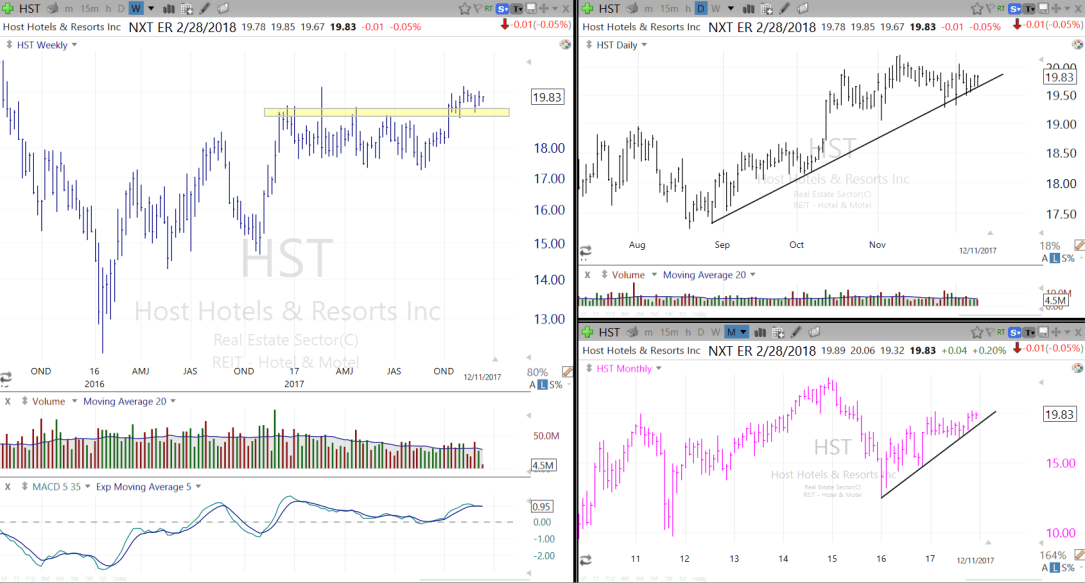
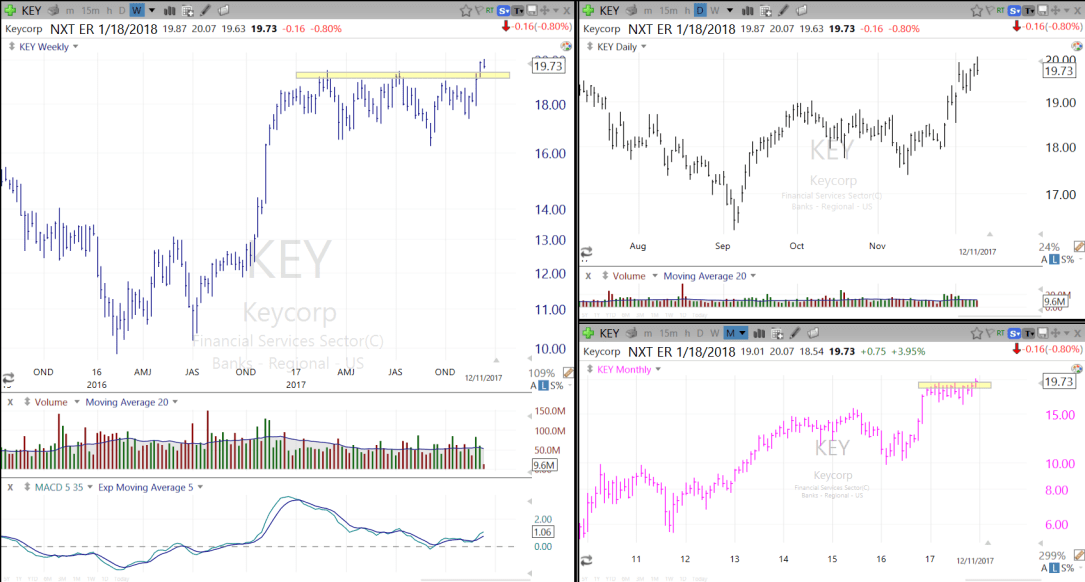
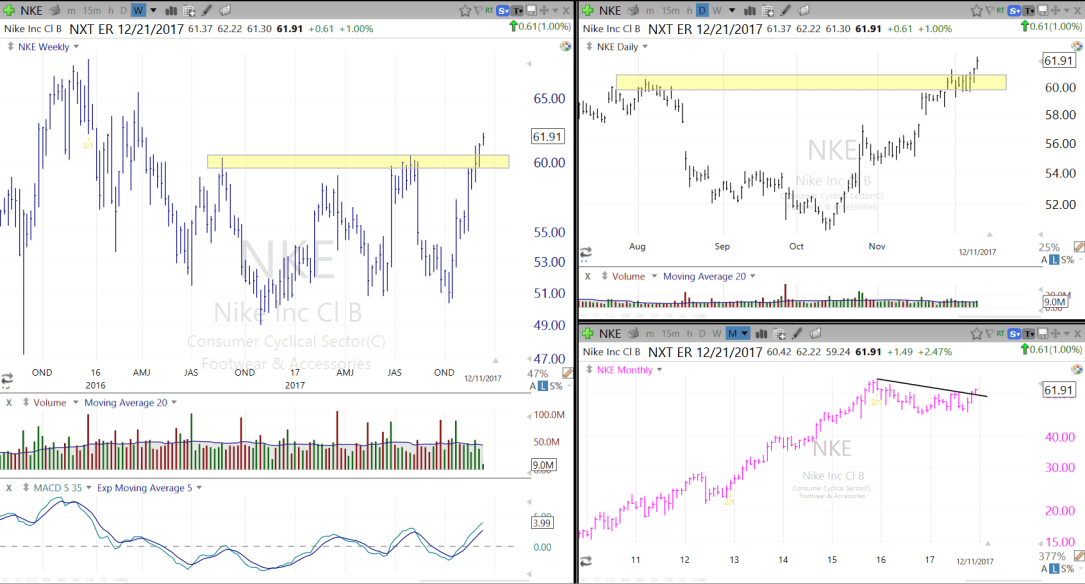
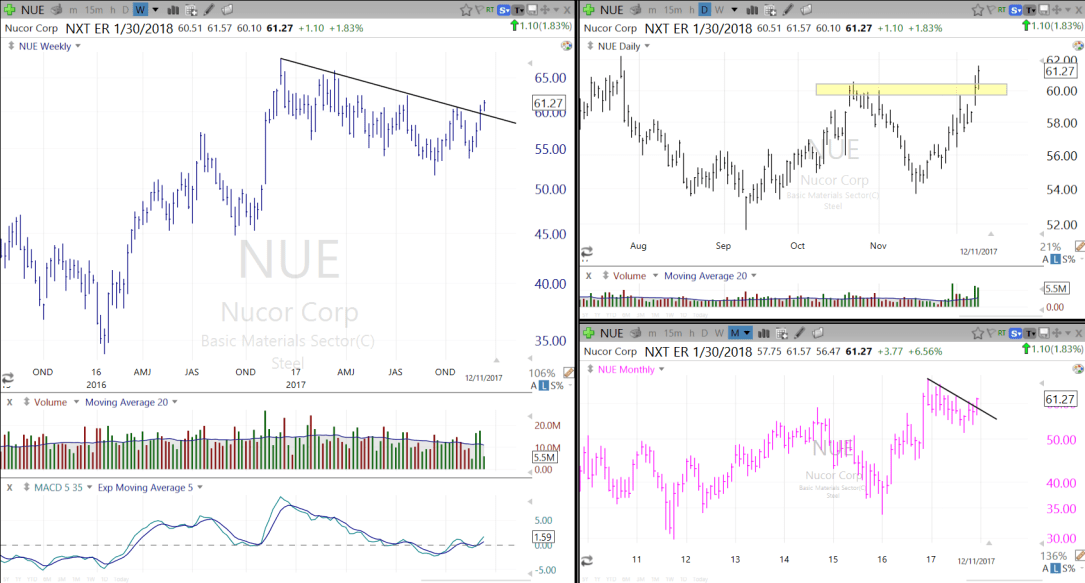
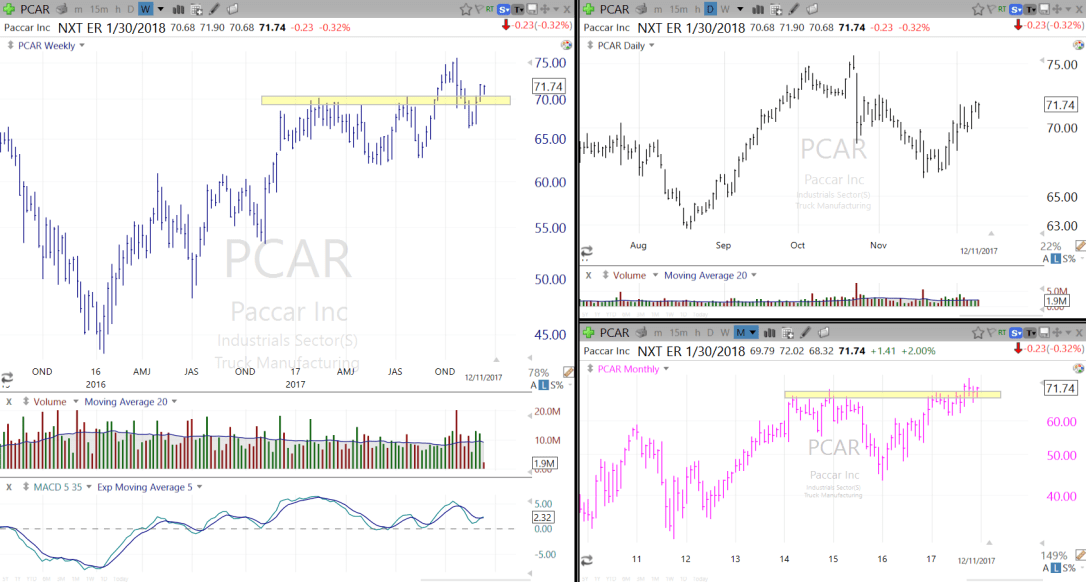
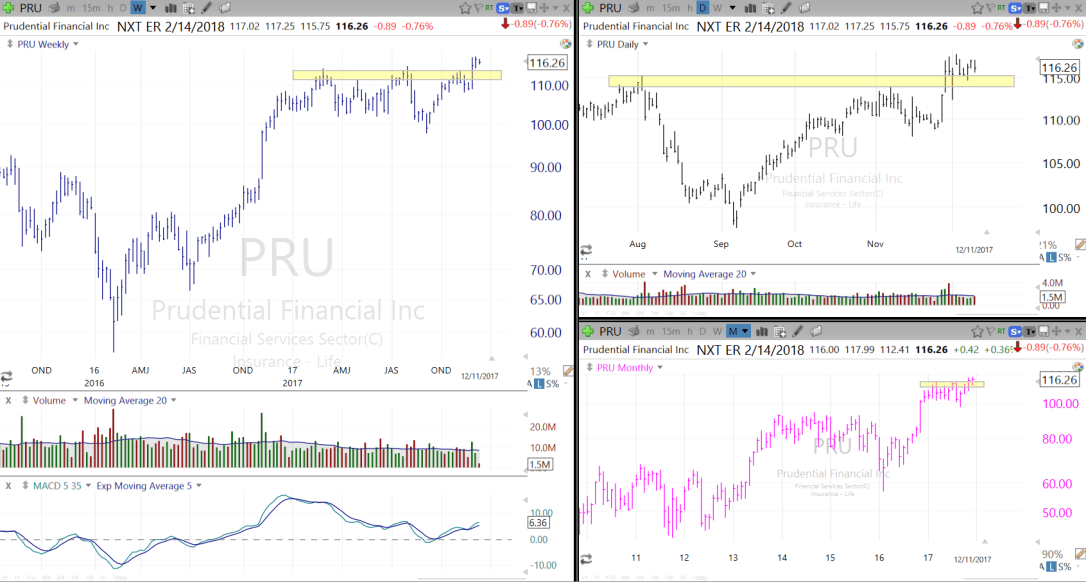
Well tonight I went through every single stock in the S&P 500. This was a fun process (I have a problem – I know) but quite worthwhile. Below I have posted charts that jumped out at me during my review. This is a different look from how I normally post charts. The weekly chart along with volume and a momentum indicator (MACD) are on the left, the daily chart w/ volume is on the top right, and the monthly chart on the bottom left. I enjoy doing this type of research (again hard to understand if you are not a chart nerd like me) and hope you find it helpful. I provide numerous watchlists and reviews for members at TTPTrading.com along with real time trade alerts so please check it out if you are interested. We are just getting going and I believe we will continue to provide great value to our members. Early bird pricing is still available.
Here’s the charts:


 I’d say there are a lot of good looks in the bunch. Again, I hope you find this useful and please check out https://ttptrading.com/. Feel free to reach out if you have any questions.
Have a great night.
Greg
