
I have mentioned before how weekly charts are my default view when analyzing any stock. Although I use shorter time frames to determine my trade entries and exits, weekly charts going back a few years, are what I primarily base my trade decisions on. Using longer-term weekly charts I can quickly identify the trend and can see if there may be any potential overhead resistance areas that might be missed when only looking at shorter time frames.
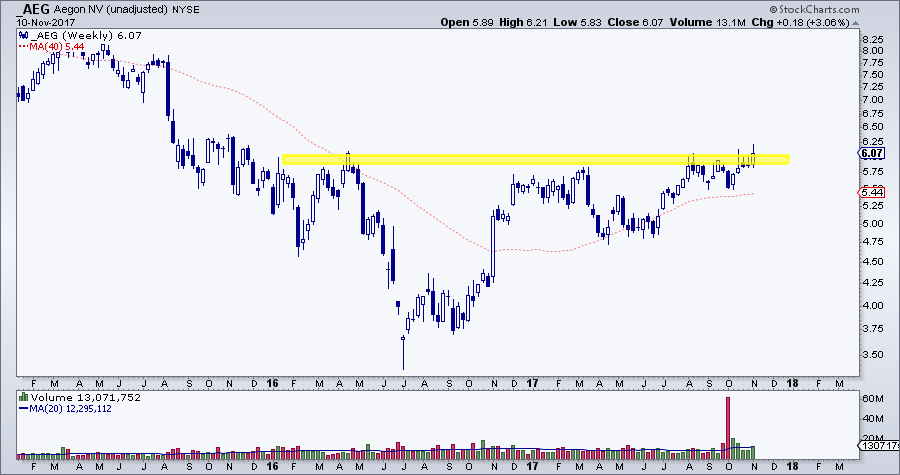
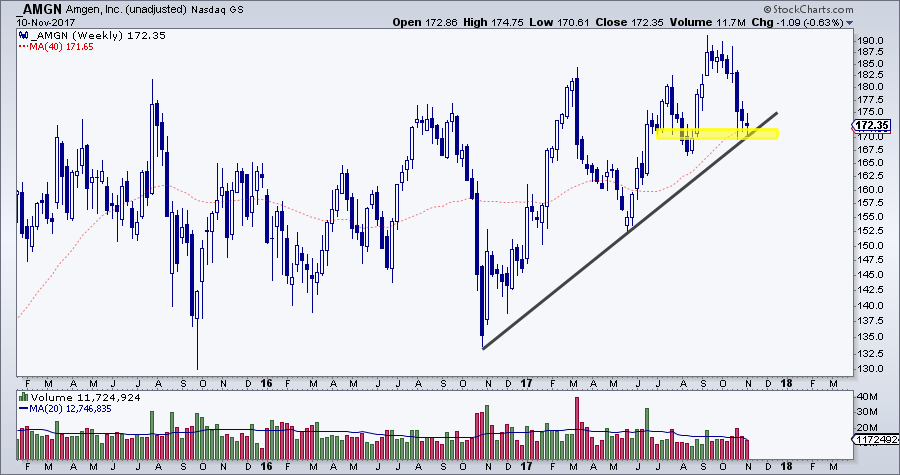
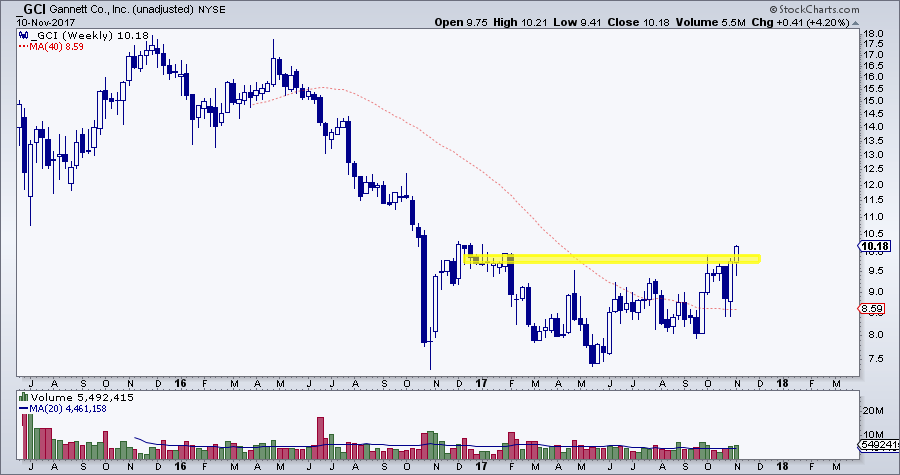
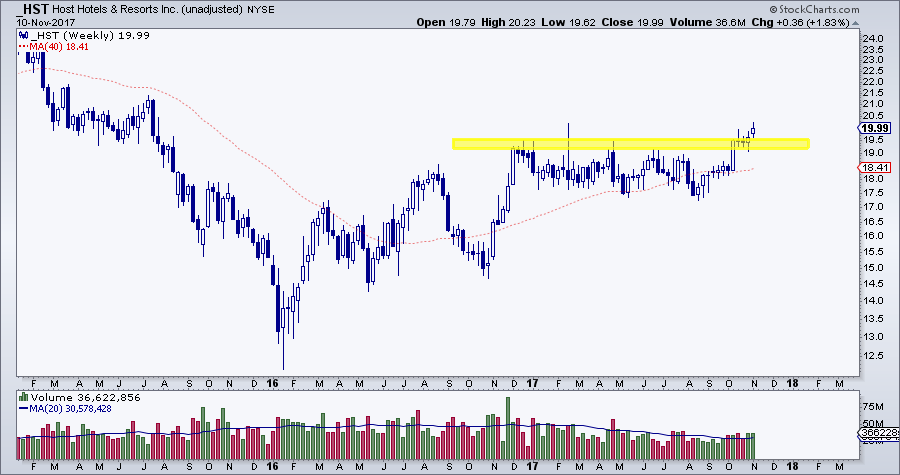
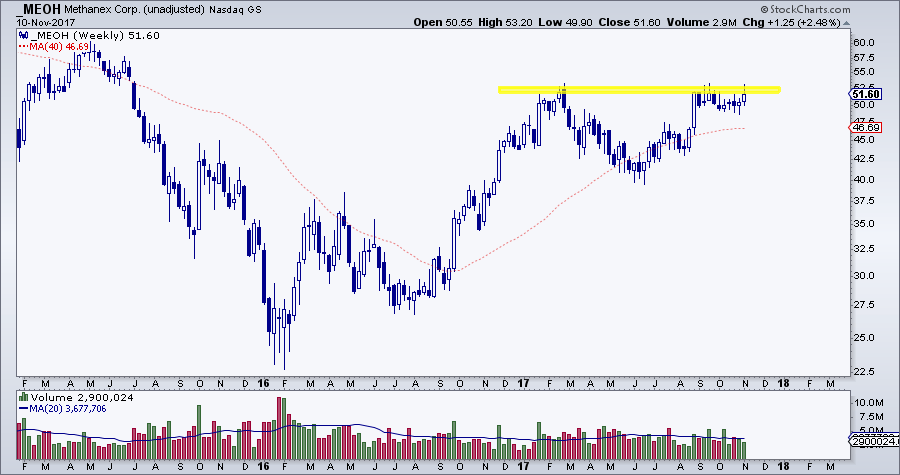
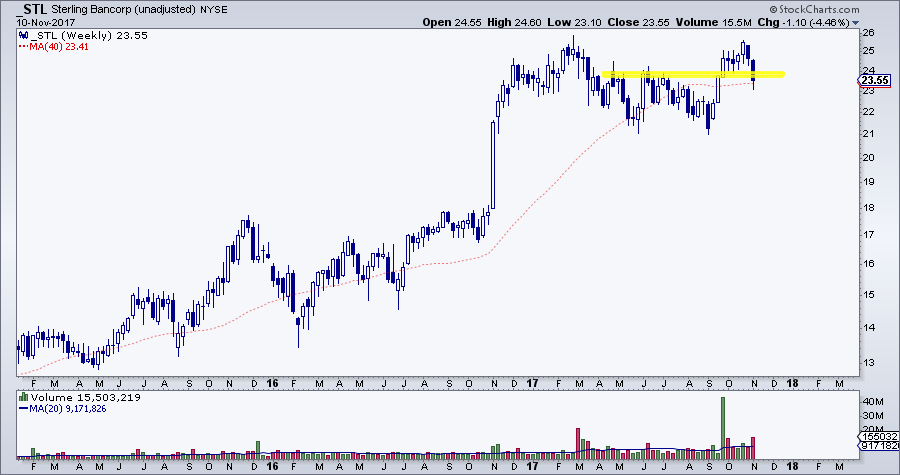
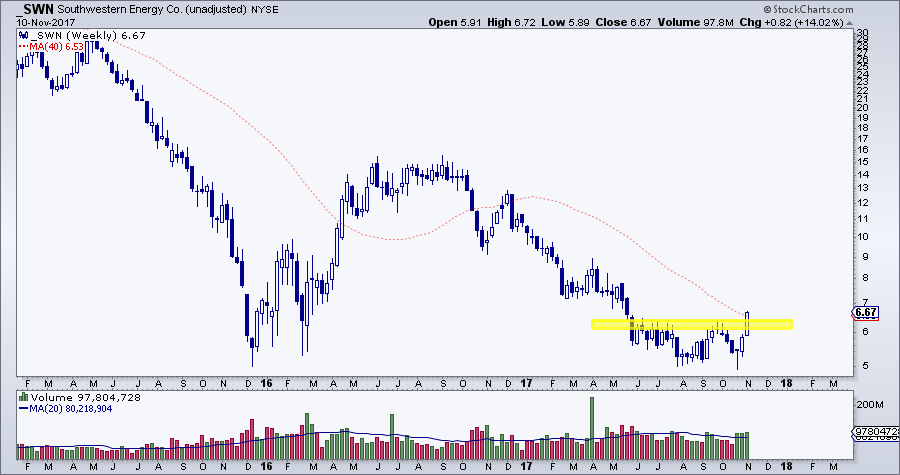
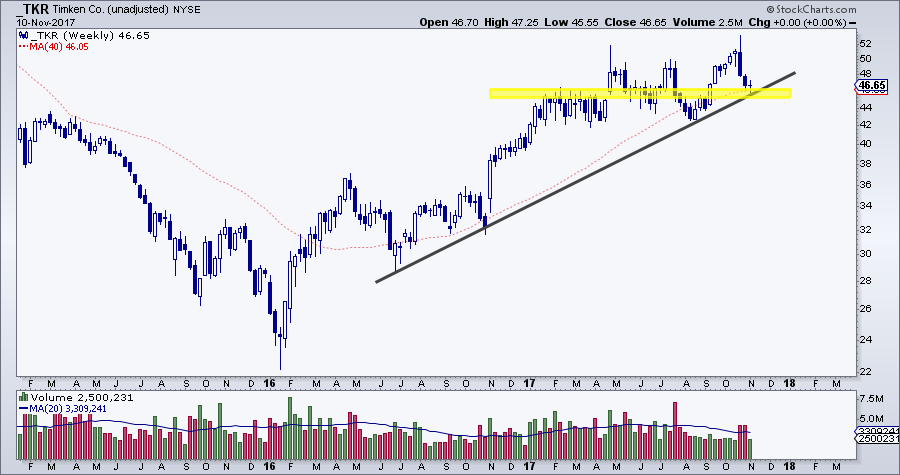
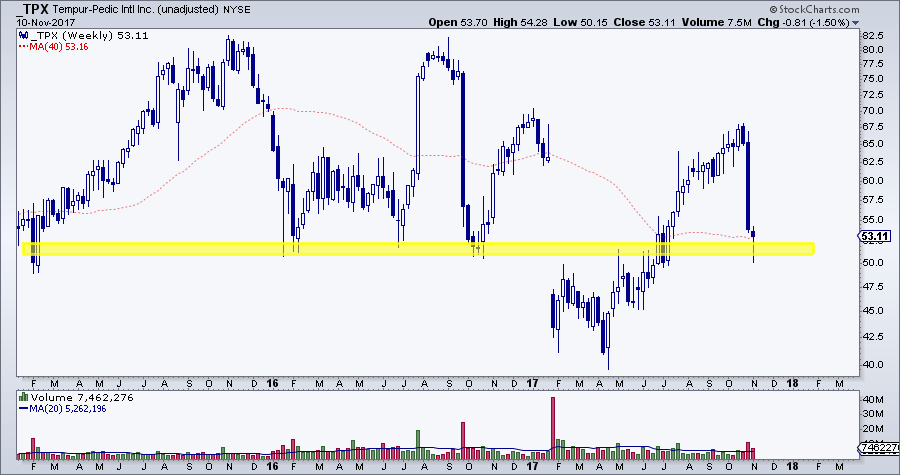
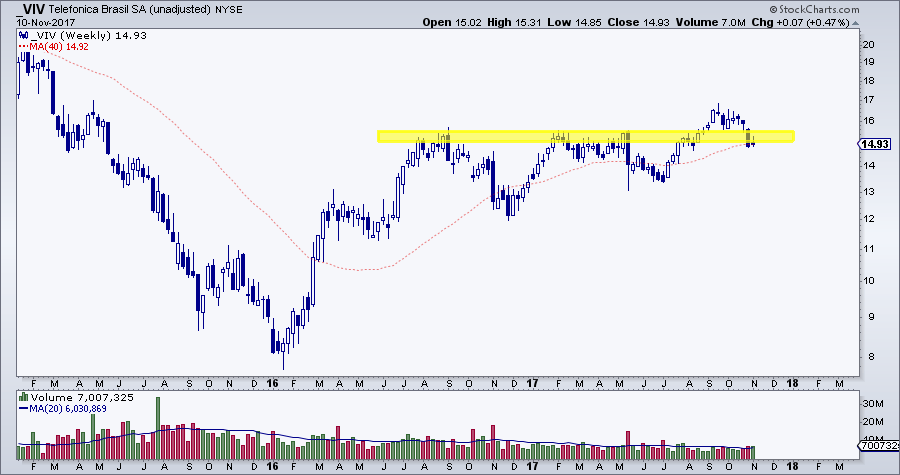
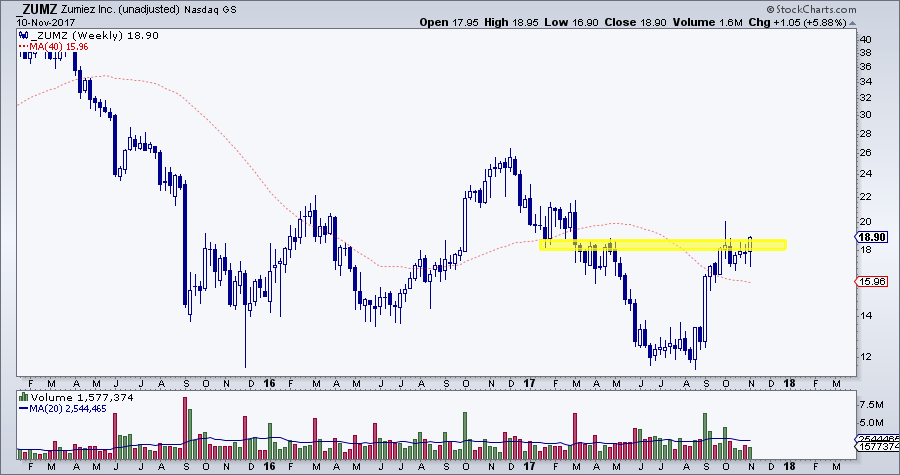
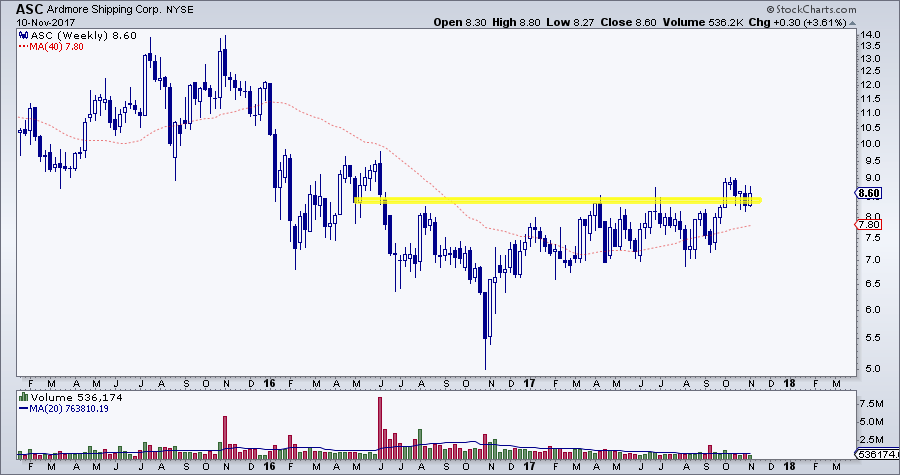
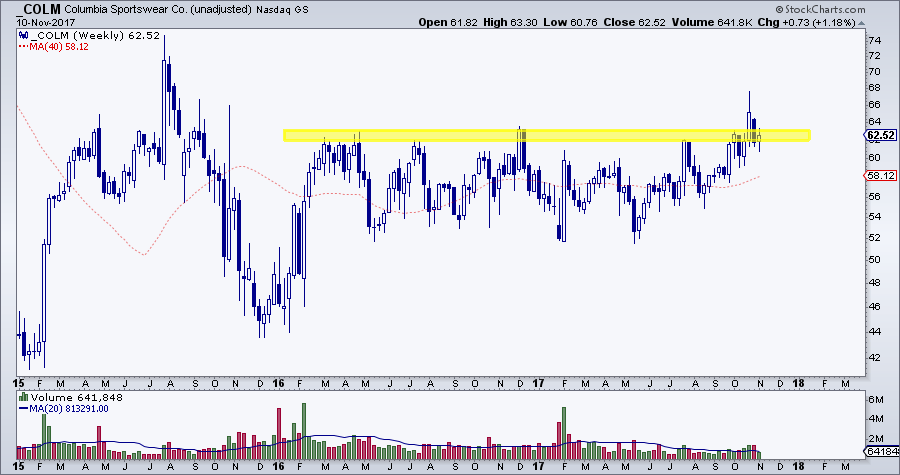
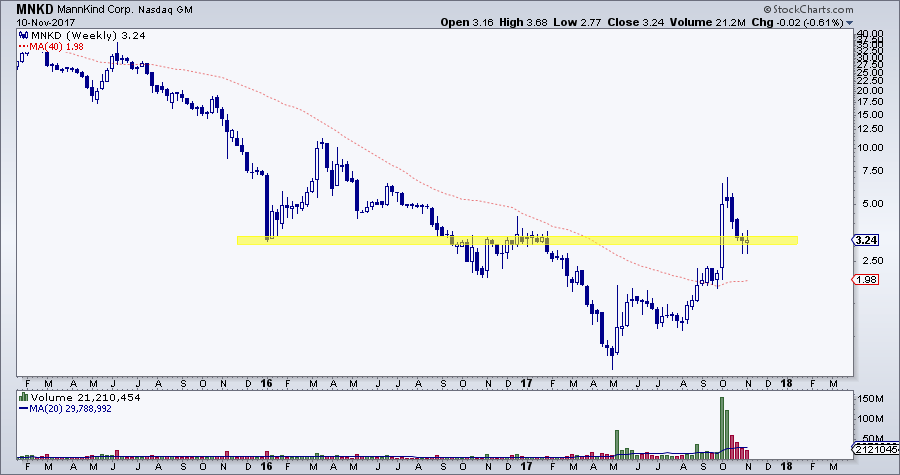
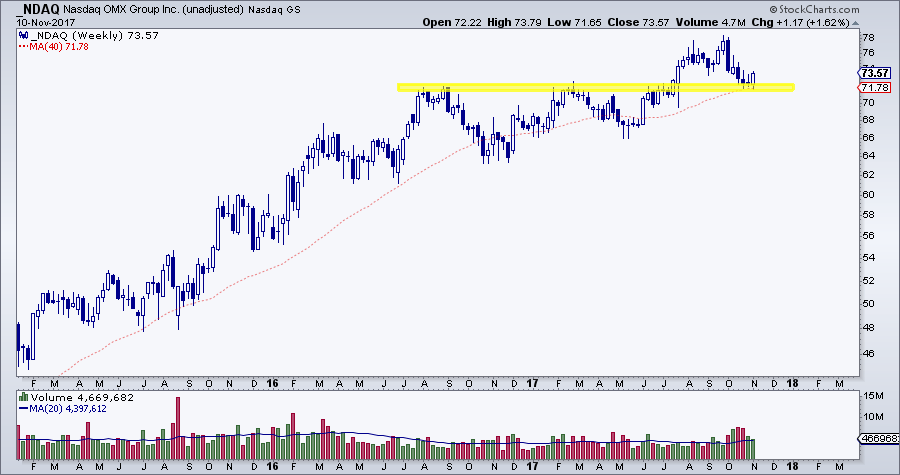
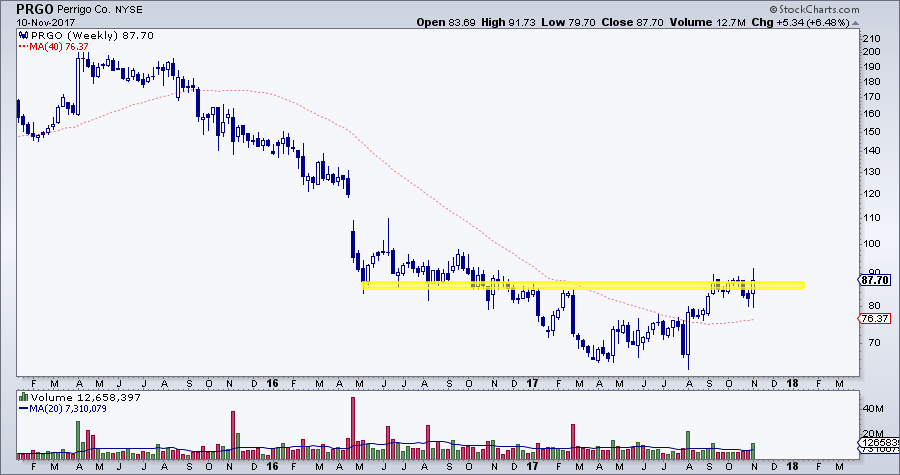
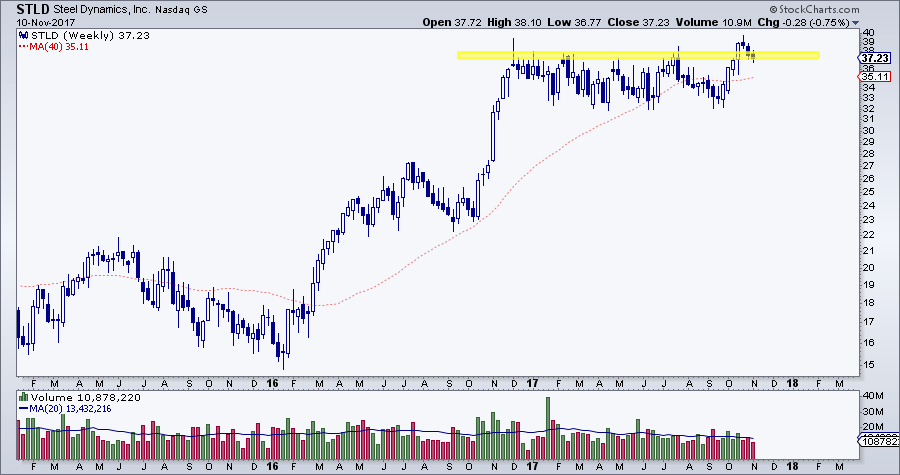
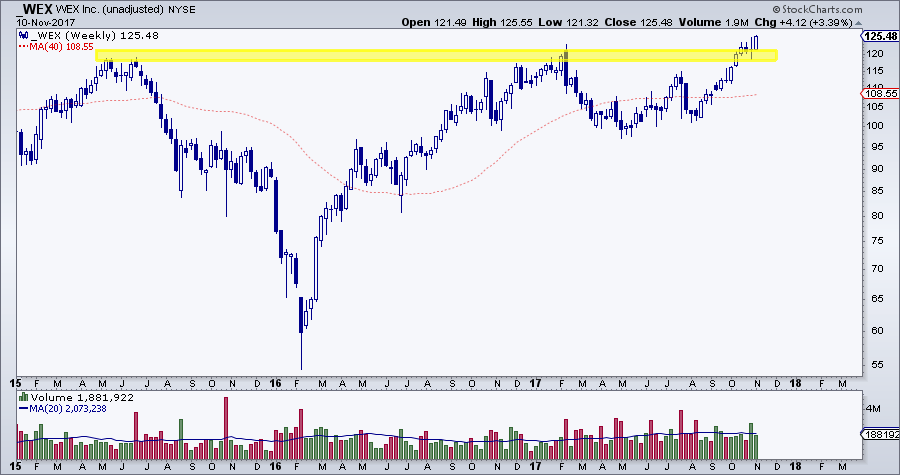
I’ll get right to it. Here are a bunch of weekly charts that have my attention going into next week. As usual I’ve highlighted key areas. For long ideas, I’m only interested in these above these areas.
Thank you for your time and have a great weekend!
