
NVIDIA (NVDA) has arguably been the biggest story in the market this year. No wonder. This big cap name has moved up over 200% so far in 2023 and it’s up over 300% from the October 2022 lows. 4X! It has been an absolutely great one to own over this time. It has acted really well since breaking the 190 level in late January and has given no major warning signs the move was ending, at least from my perspective. That is, until now.
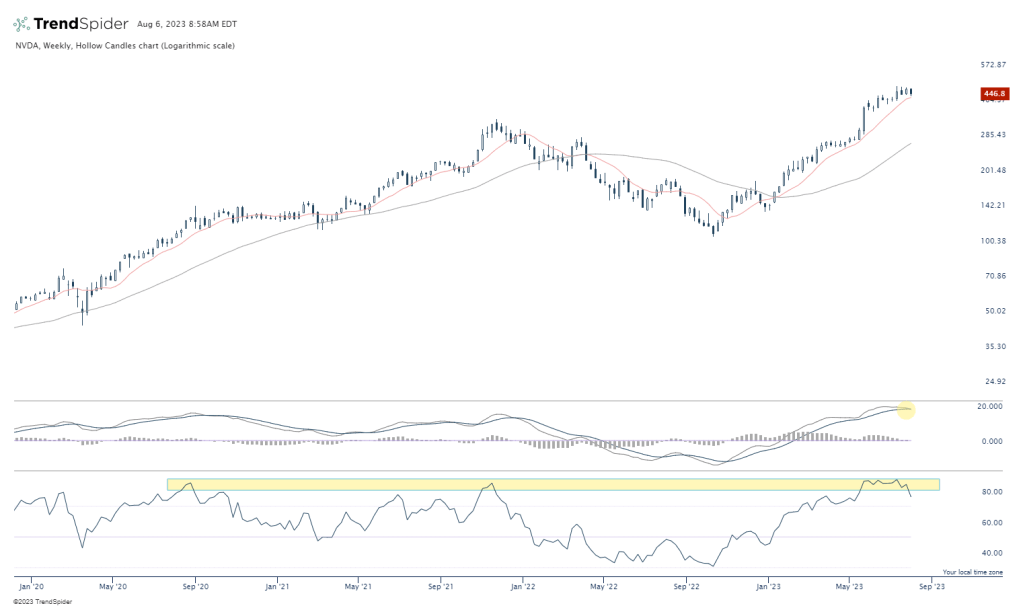
The momentum in this name has obviously been super strong. Weekly RSI (a measure of momentum) has been in an “overbought” range (over 70 is the standard definition) since March 2023. This was obviously not a good sell signal as it’s ran up another 75% from there. “Overbought” can be misleading. On one hand, it means the stock is running a bit hot, but on the other hand, it also means there’s big time demand for the stock, which continues to drive the price up. It’s a sign of strength. It’s not until the momentum starts to slow or reverse that gives me a warning sign the move might be ending, or at least taking a breather to consolidate. Notice I said warning sign, not a signal. Price above all.
Anyway, take a look at the weekly chart with PPO and RSI on the bottom panes. PPO (which is very similar to MACD) looks to be curling down and generating a sell signal. We haven’t had that in this run from the October lows. Also, you can see at the very bottom that RSI has been well over 80 for quite some time and is moving back down. Price is still in an uptrend and above the 10 week (in red) and 40 week (gray) which are both rising, so the slowing momentum is just a warning sign for now.
Then there’s the fundamentals. Don’t worry, I’m not going to get into the weeds here. This is clearly a “story” type stock driven by future aspirations/AI and isn’t subject to all the same valuation metrics of its peers. However, if the demand to buy these shares starts to wane, perhaps this matters and becomes part of the story. Here’s a quick look at some valuations metrics of NVDA vs. the other large cap semiconductor names:
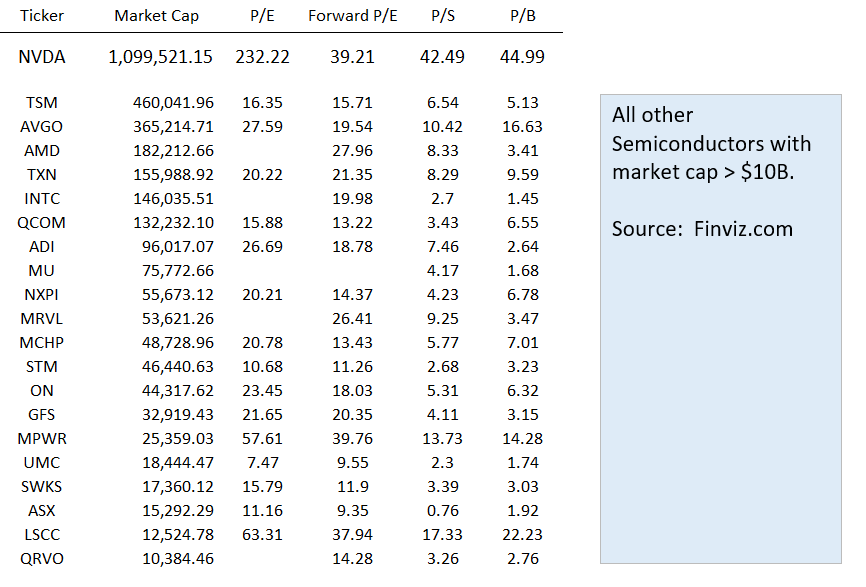
NVDA is clearly in a league of its own compared to these other names. For example, it’s valued at 42x sales while the average of all the other names with market caps exceeding $10B is a little over 6. Big difference.
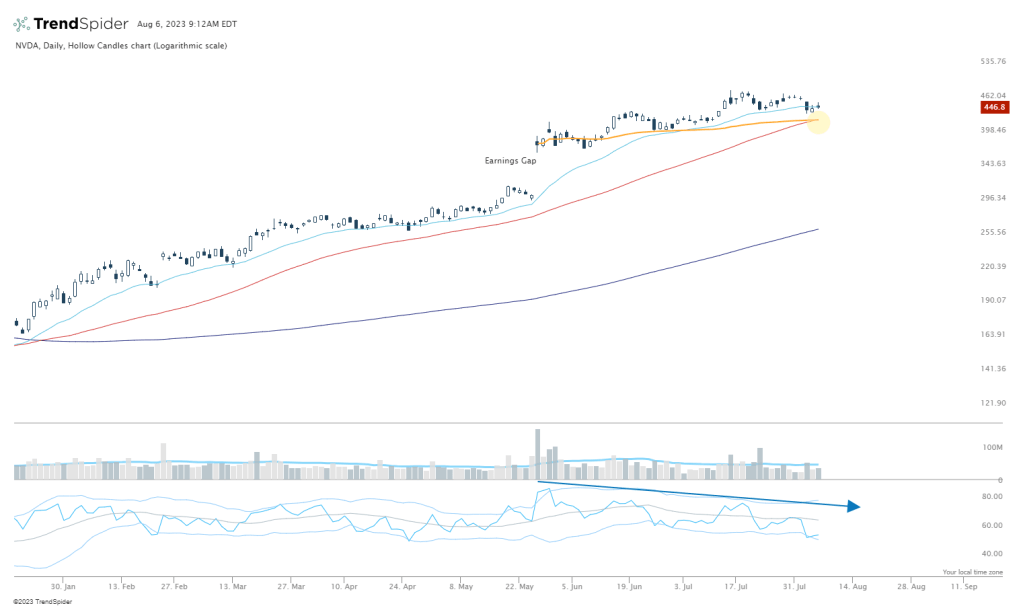
So here’s what I’ll be watching closely on this name in the coming weeks. If the market continues to cool or consolidate, I think there’s a decent chance NVDA returns to the $420 (give or take a couple dollars) spot. This will be one to watch, as it will be close to its anchored VWAP from the May gap up after earnings came out (that’s the orange line). This will also be very close to its rising 50 day moving average (red line) which has potential to act as support, especially in growth type names. So, perhaps a battle to come around that level would determine if buyers or sellers are in control. Notice that momentum shown below is diverging from price recently. If I owned the name (which I don’t currently), if it gives that spot up, I’d be out of some or all of my position. I’d also strongly consider entering or adding a short position near this area, especially given the momentum loss after a parabolic run up on the higher time frames. Earnings are due 8/23 so please be aware of that.
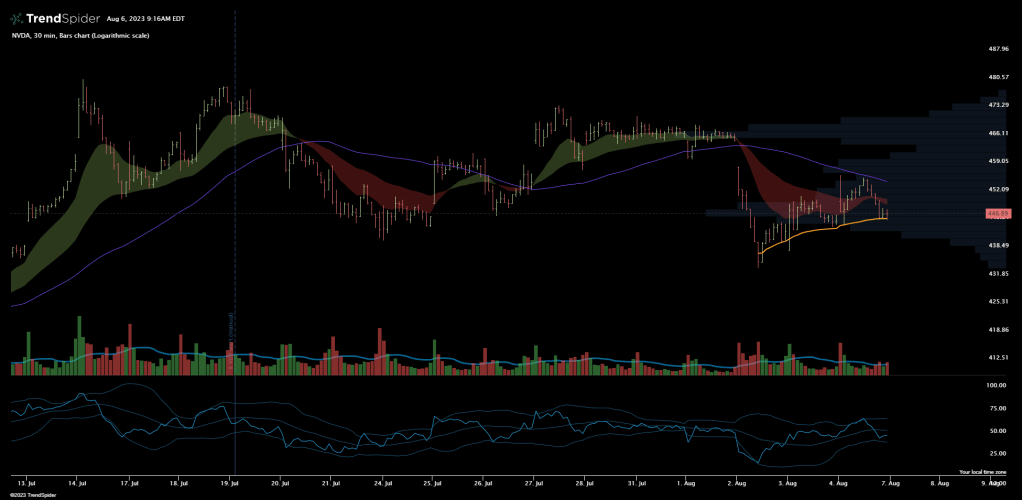
Here’s a zoomed in look at the 30 minute chart. If you are a quicker trader, and think based on higher time frames and general market conditions, a date with this $420ish level is likely, perhaps you’d consider shorting now. I think think the risk / reward looks good on that idea at least as of Friday’s close, and barring any big gaps Monday. For me, I’d look to short on a break below $443 (below the 8/3 close and a lot of volume traded around that level) with a stop just a few dollars higher ($449ish).
Thanks for reading! I just wanted to get some thoughts out on NVDA that I couldn’t fit into a tweet. I think there’s some potential opportunities presenting themselves for this name.
Also, if interested, TrendSpider is having a great bundled package sale this weekend. I use TrendSpider for my daily charting and also love the backtesting features. Check it out – TrendSpider
