There is definitely a time to own precious metals and a time where there are massive opportunity costs with owning these assets. For the purposes of this write-up, I’m focusing on silver but gold, miners, etc. could also be considered.
Let me get right to it. I think there is a fantastic opportunity for owning silver that is presenting itself right now. There are many data points that can be considered but I’ll just focus on a few here. First, let’s take a look at silver vs. US stocks (represented by the S&P 500 index). As shown in the chart below, which is silver relative to SPX going back 30 years, there have been huge performance trends. At times, owning silver over stocks would have been a terrible allocation choice. For example, from February 1994 to September 2000 silver underperformed SPX by 75%. From April 2011 to August 2018 silver underperformed SPX by a whopping 86%. It sure doesn’t pay to be stuck to an idea / theme. At least if you want to make money. But then there’s that move from late 2001 through Spring of 2011 where silver outperformed SPX by around 850%. Being in the right asset here (silver in this case) could have led to exceptional outperformance and profits. Obviously, it will be hard to repeat such a move and this is just one example, but I think it’s possible we may be setting up for another extended period of outperformance for silver vs. US stocks.

As shown above, after the huge run silver had this summer, the relative performance vs. SPX broke out of a two year base. Recently it came back to retest that level, highlighted in yellow, and the retest was successful. A similar breakout, although the base wasn’t as long, happened back in 2016 and went on to fail pretty shortly after. Of course, that is a possibility here and if that happens, my thought that silver is set to outperform would be considered wrong and it would be time to move on. It happens all the time. No big deal. Just have to keep the losses small and move on.
Below is a weekly look at the same chart. I like what I see.

OK. So it looks like silver may be setting up a new uptrend vs. SPX. Great. But now let’s look at the actual chart of silver (I use the ETF SLV).

The above is the monthly chart going back to 2016 with volume by price anchored to those 2011 highs. You can see that beautiful breakout in July of this year that resulted in about a 60% move in a couple months. The move then stopped around the $27 area (yellow rectangle). Not coincidently, this was support in 2011 and 2012. This happens over and over again – what was support becomes resistance. Amazing and probably my favorite thing about studying charts. So before I personally get really bullish on silver and allocate more money to the idea (I have a smallish SLV position currently along with February 2021 calls) I need to see price can prove it can push through this level. I like what I see with what looks to be another run at it after the dip but still not there so this is a really big area I’m watching.
Let’s check out the weekly chart. Notice this level around $21. This is a 38.2% retrace of the move off the March bottom (and a 68% retrace from that breakout this summer). So an important level that price has held twice now.
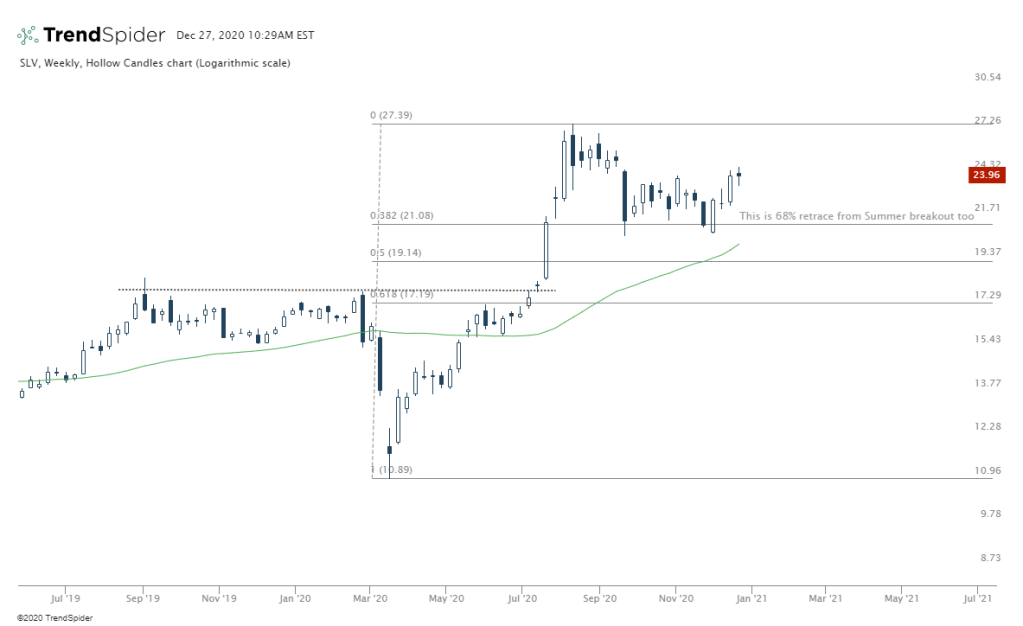
Now let’s check out the daily chart below. Pretty much dead money since that August high. There are some interesting developments though. The VWAP anchored to the high and acted as resistance in November (see arrow) is now just under price. A positive. The yellow highlighted area was support for a time in August and has so far acted as resistance. Before getting too excited, we need to get through this spot (around $25) and I think it looks ready. If we can push through here, the lows from last week (around $23) which is also under the anchored VWAP look like a good spot to manage a trade from. At least to me. So if I add a position on a break of the yellow area, my stop would be around $23 to get me out quickly with little damage if price moves against me.

Another item worth noting is seasonality for SLV. As shown below from the Trendspider seasonality chart, January has been the best month going back 10 years. It’s up 80% of the time gaining an average of 3.3%. This is valuable data that makes me think a break of that $25 level is more likely. It’s also valuable if this doesn’t prove to be true and SLV struggles in January suggesting maybe it’s best to focus elsewhere.

US stocks have been on a tear from those March lows. The trend is still healthy and strong. Sentiment is extremely positive and as well. See below for how far stretched we now are from historically “normal” PE levels. This is NOT tradable data in my opinion but can be useful as a sentiment indicator and to put the markets in context. Nothing is more valuable than price action and trends which remain very positive at this time but if that starts changing in the coming months, there may be opportunities outside US stocks (i.e. metals, international markets exhibiting relative strength, etc.)

So in summary, I like the opportunity being presented in silver here. It looks promising relative to US stocks and on a stand-alone basis. For a longer-term time horizon, that $27 level pointed out on the monthly chart above is critical. Without cracking that, I can’t be bullish longer-term. And if we are below that $21 level, there’s no reason to be in this trade in my opinion. You need to lay out the risks, so that’s what I’m looking at longer term. If this comes together, I think we might have a fantastic opportunity here soon.

1 thought on “Time for Silver to Really Start Shining”